107
Using Solar-Log WEB
6.3.3 Daily Overview
Start your browser and click on the bookmark for your plant.
•
You might have to log on.
•
The plant details overview is then displayed.
Select Graphic from the menu on the left.
•
The plant's daily overview is then displayed.
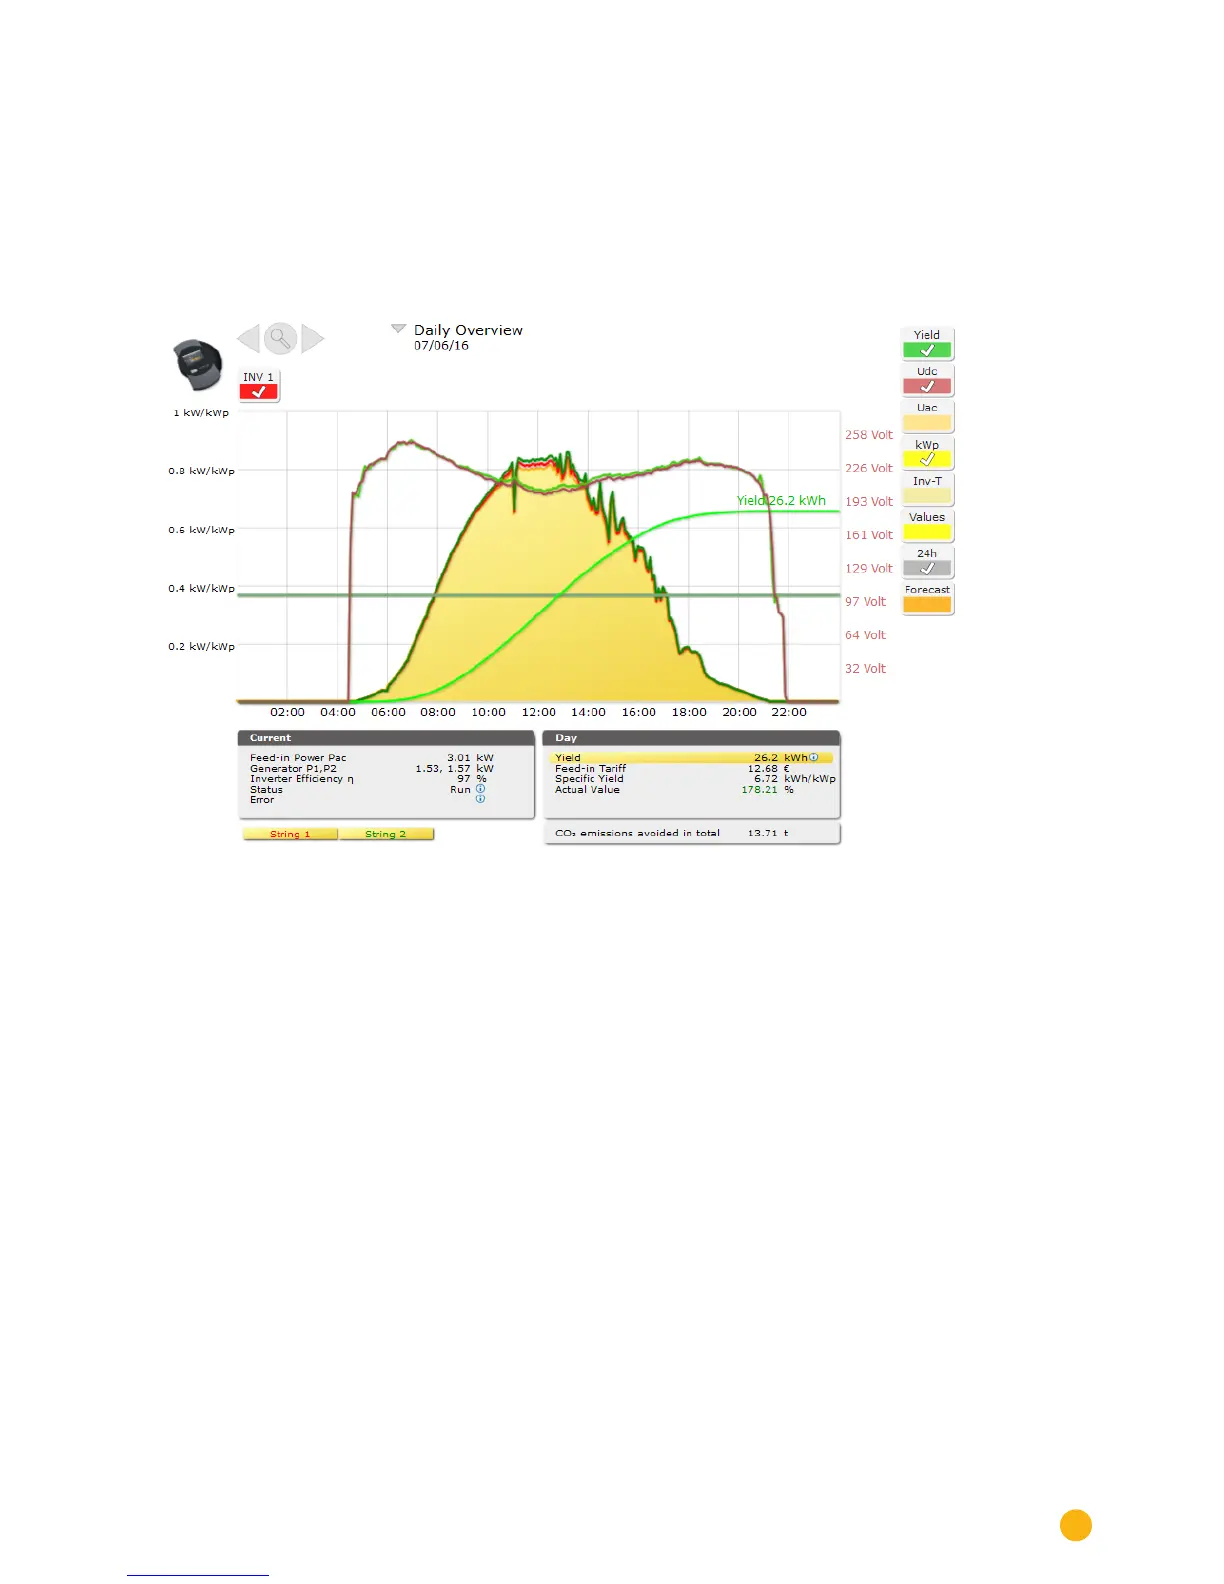
Fig.: Day curve with additional values
The daily yields are displayed as a curve graph. The dark green line indicates the daily target yield.
The different values throughout the day can be displayed by moving the mouse along the curve.
Daily Overview selection buttons
•
Yield: Yield curve from which the yield performance can be observed. Additionally, the dark green
line indicates the daily target yield total.
•
DC voltage: Generator voltage; To view the voltage of individual strings, only one inverter can be
selected.
•
kWp: Switches the scale from "Output in watt" to "Output in kW/kWp." After that, all of the curves
will be comparable in regard to their specific output. Diminishing module performance can also be
recognized.
•
24h: This displays the output for every hour of the day in comparison to the consumption for the
entire day.
 Loading...