38
Operating via a web browser within your own network
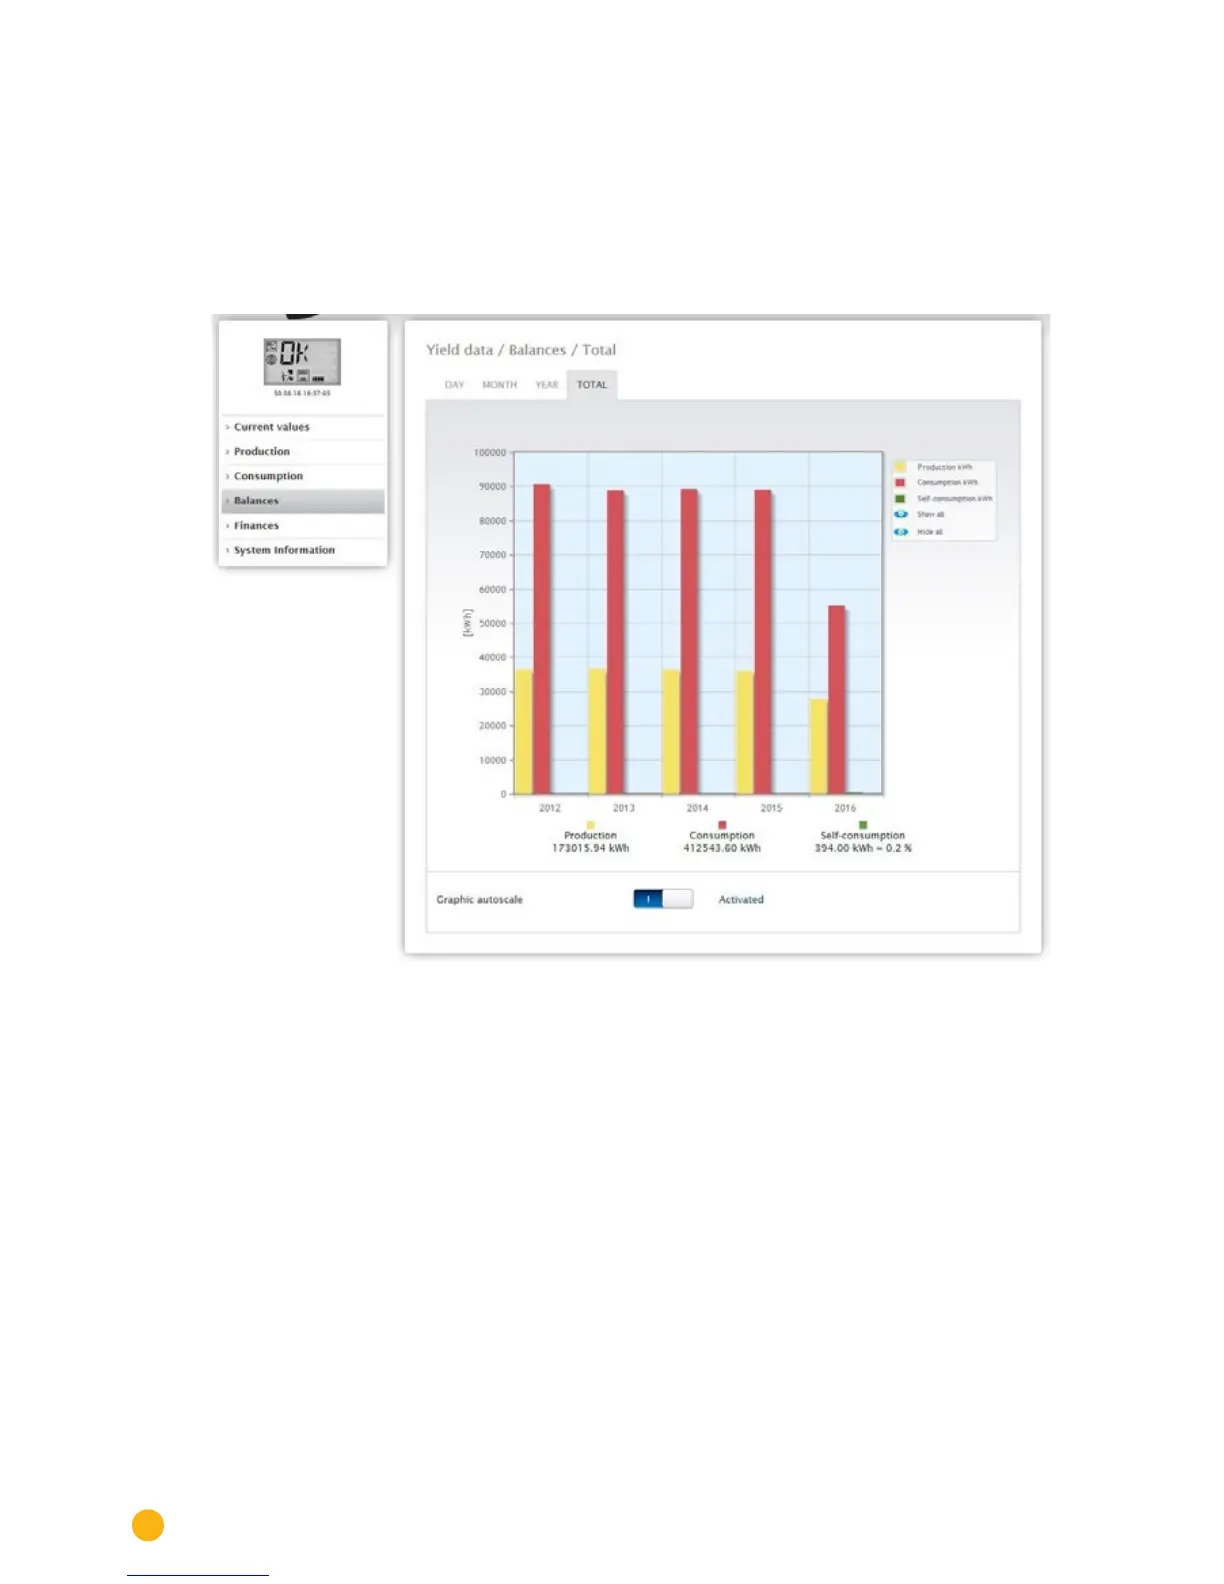
2.7.4 Total balance
The Total tab under Balances displays the production and consumption side-by-side in
a bar graph.
•
Move the mouse above one of the bars to view either the annual yield or consumption with a com-
parison of the current and target values in regard to the annual forecast.
•
Click on one of the bars to go to the corresponding annual overview.
Fig.: Total balance graph