15
Operating via a web browser within your own network
2.4 Accessing Yield Data
Access the yield data from the header bar.
The following options can be selected from the left-side navigation menu.
•
Current values
•
Production
•
Consumption (only appears when a consumption meter is connected)
•
Balances
•
Finances
•
Sensor (only appears when a sensor is connected)
•
System Information
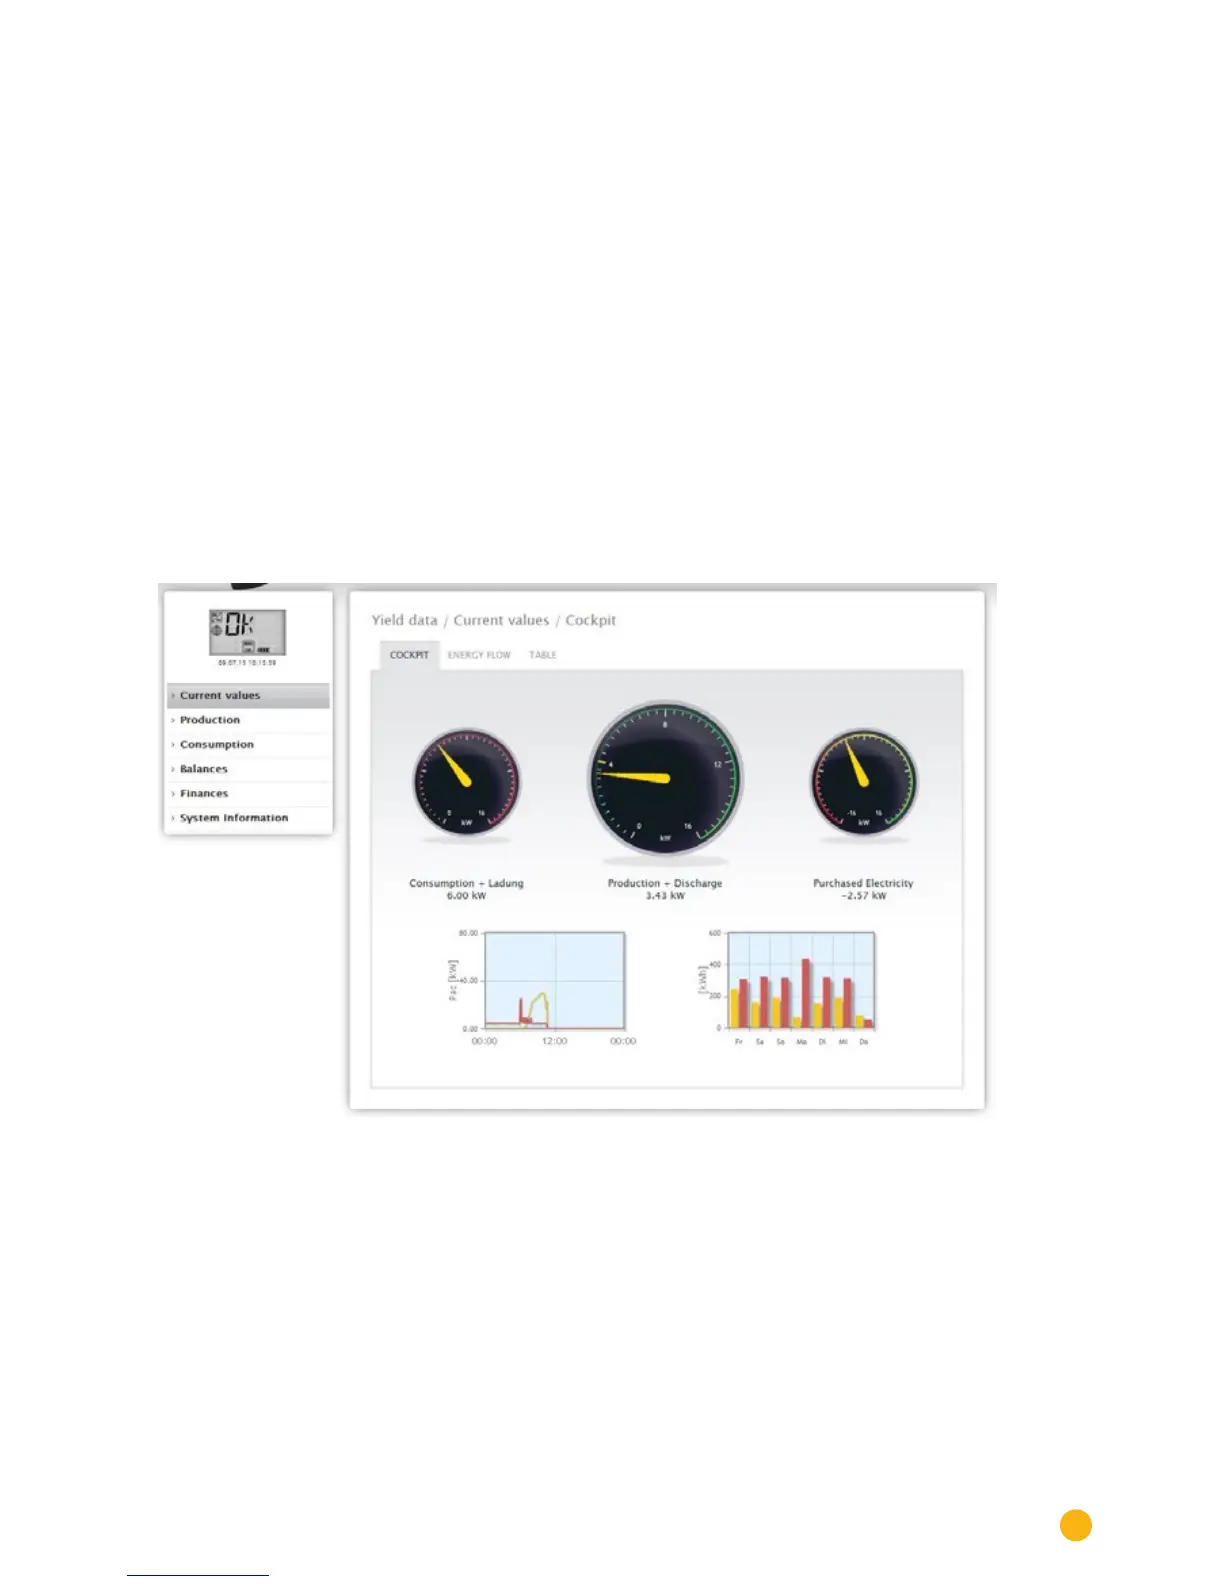
2.4.1 Current values
The Cockpit tab can be automatically selected from the Current values . the Dashboard view of the plant
includes the following values:
Fig.: The plant's current values (cockpit view)
•
Consumption (only when consumption meters are connected). This displays the current consump-
tion.
•
Production (power generated by the plant) + discharge *only with a connected battery system)
displays the current production and battery discharge.
•
Feed-in amount (only when meters are connected). This displays the power output that is currently
being fed into the grid.
There are two graphs located below the Dashboard display:
•
The current day curve (graph on the left). There is also the option to display the previous five days
as a curve in this graph. Therefore, just click on the day value in the graph on the right.