110
Using Solar-Log WEB
6.3.5 Annual Overview
Select Annual Overview from the navigation menu.
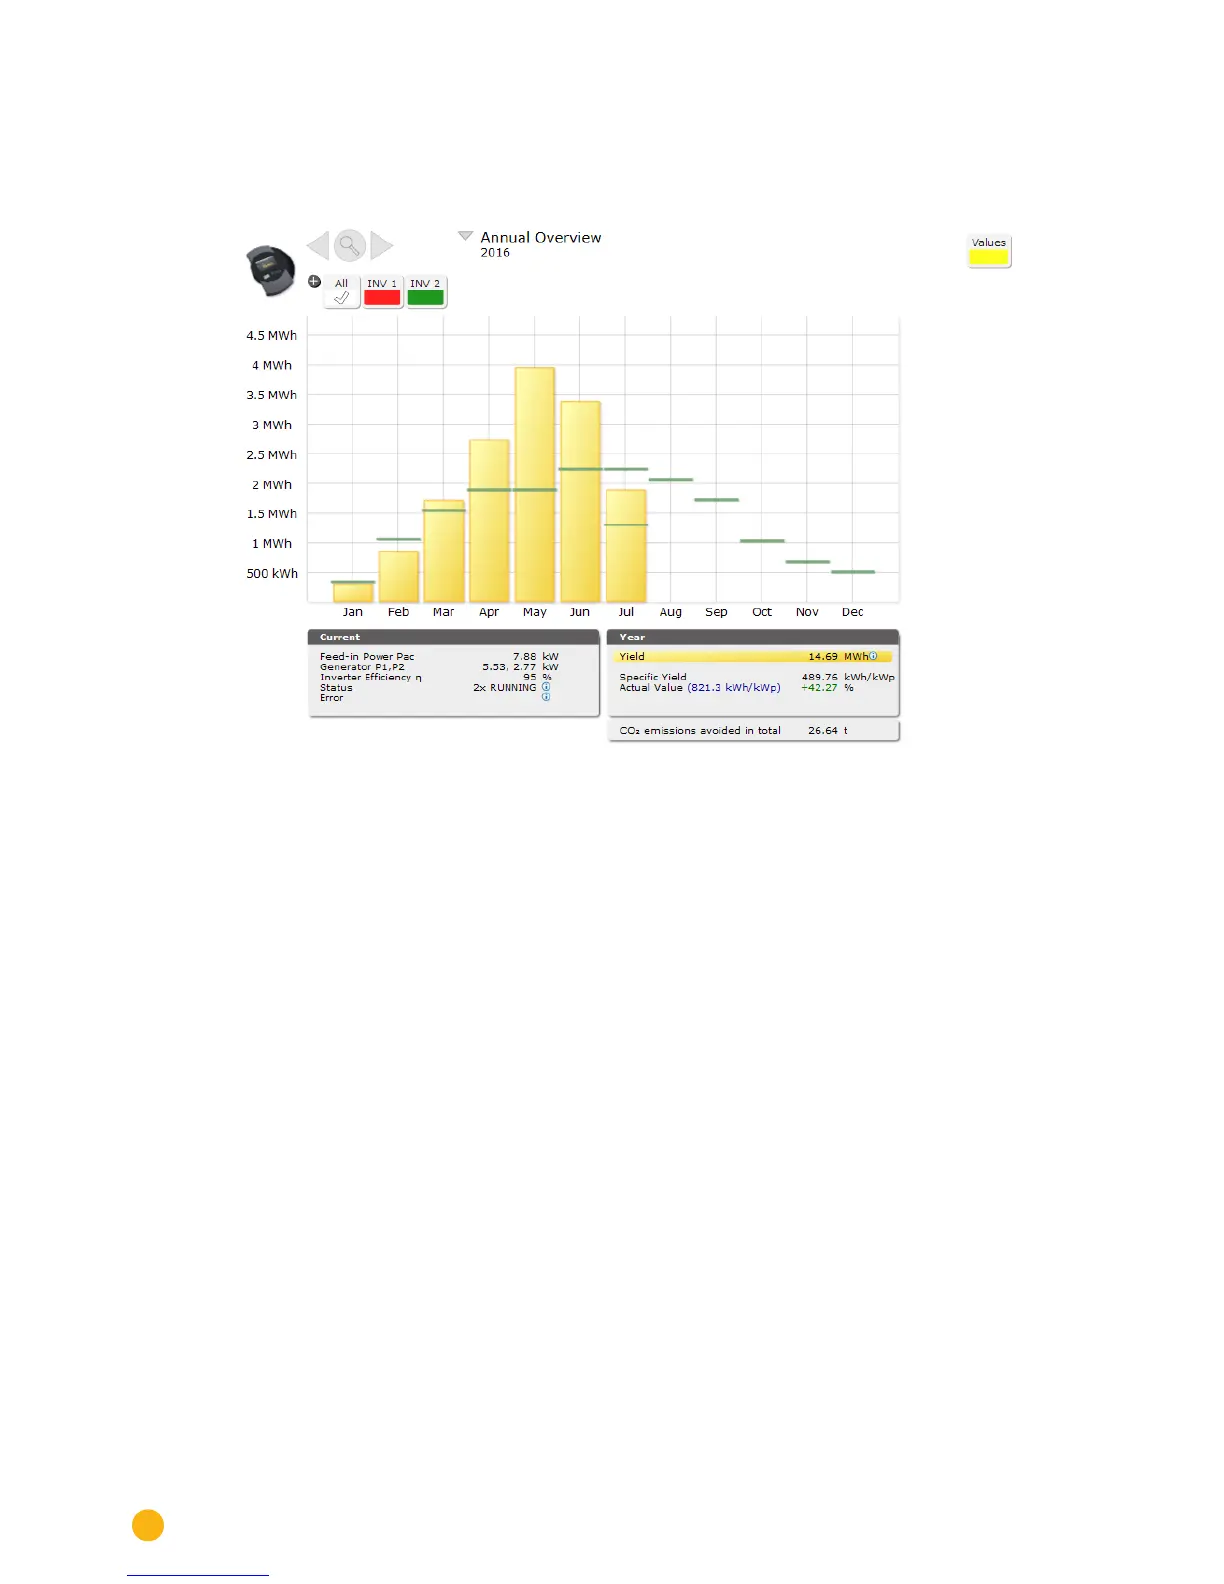
Fig.: Plant C2 - Annual Overview
The monthly yields from a year are displayed as a total in a bar graph. The dark green lines indicate the
annual target yield.
The forecast value is calculated from the yields already achieved for the year and from the projected yields
from the remaining months of the year.
Move the mouse above one of the month bars.
•
The yield from the selected month is displayed.
By clicking on a bar,
•
the corresponding monthly overview is displayed.