Home
Solar-Log
Measuring Instruments
1000
Page 23 (Fig.: Month View of the Production Table)
Solar-Log 1000 - Fig.: Month View of the Production Table
127 pages
Manual
Save Page as PDF
To Next Page
To Next Page
To Previous Page
To Previous Page
Loading...
23
Operating via a web browser within your own network
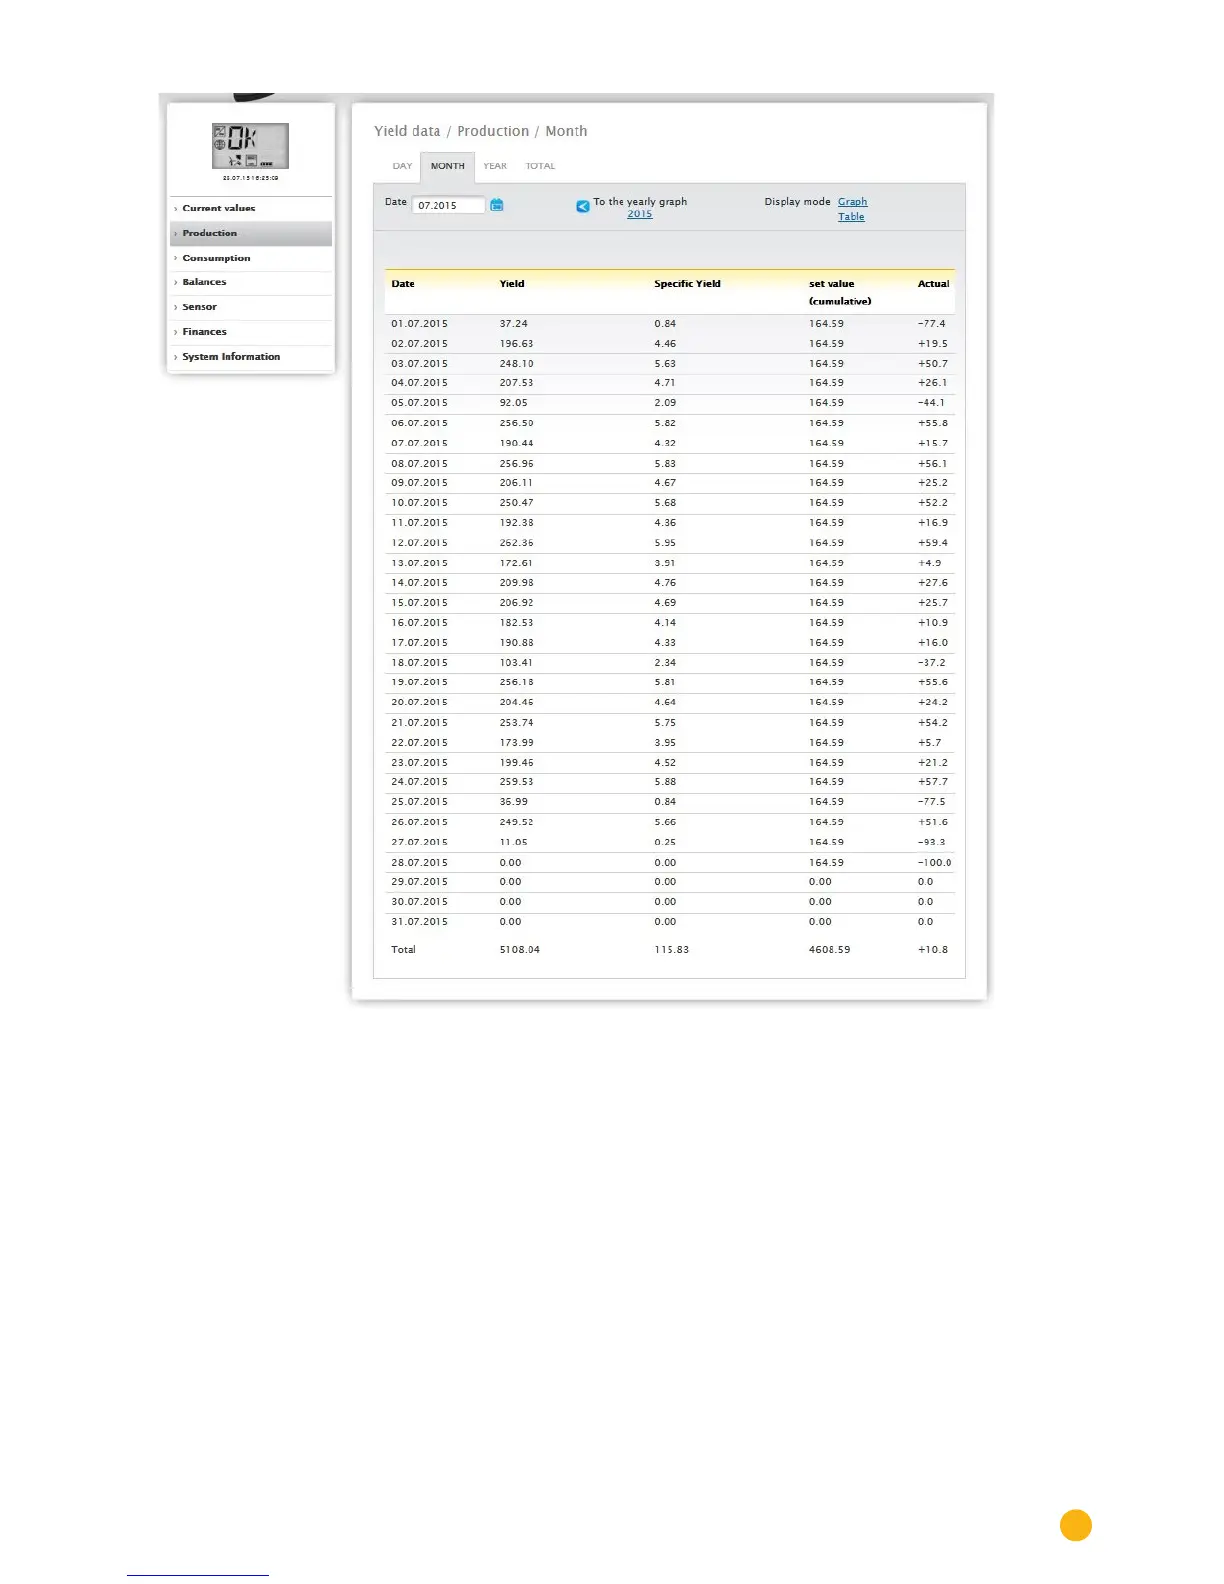
Fig.: Month view of the production table
When you click on
Table
, the values: date, yield, specific yield and target (cumulative), current and target
are listed for the entire month.
22
24
Table of Contents
Main Page
Table of Contents
3
1 General Information
6
The Necessary Steps for Precision Monitoring of Your PV Plant with the Solar-Log
6
Requirements
7
Overview
8
General Navigation
8
Fig.: Navigation Designations
8
Fig.: Log in Button with Selection Box
9
Fig.: Header Bar with the "Hide Arrow
9
Fig.: Signal for New Firmware
9
Fig.: Automatic Firmware Update Check with Notification Text Displayed
10
Fig.: Window Displayed Indicating that a New Firmware Version Is Available
11
Accessing the Start Page
13
Fig.: Welcome Screen
13
Fig.: VLCD Display
14
Accessing Yield Data
15
Current Values
15
Fig.: the Plant's Current Values (Cockpit View)
15
Energy Flow
17
Fig.: Example of a Plant with an Energy Flow
17
Table
18
Fig.: Table with the Recorded Output from an Example Plant
18
Production
19
Fig.: Graphic Display of the Plant's Total Production
19
Day View
20
Fig.: Daily View of the Production Graph with the Auto Scaling Activated
20
Fig.: Day View of the Production Table
21
Month View
22
Fig.: Month View Production Graph
22
Fig.: Month View of the Production Table
23
Year View
24
Fig.: Year View Graph
24
Total View
25
Fig.: Total View Graph
25
Consumption
26
Fig.: Graph of Daily Consumption with Connected Appliances in the Sub-Consumer View
29
Fig.: Graph of Daily Consumption with Connected Appliances and Active Line Graphics in the Sub-Consumer View
30
Balances
32
Fig.: Day Balance Graph with Battery System
33
Day Balance
34
Fig.: Daily Balance Graph with the Auto Scaling Activated
34
Month Balance
36
Fig.: Month View Balance Graph
36
Year Balance
37
Fig.: Year View Balance Graph
37
Total Balance
38
Fig.: Total Balance Graph
38
Finances
39
Fig.: Finances Overview
39
Sensor
41
Fig.: Graph of Sensor Box Values
41
System Information
42
Fig.: System Information from an Example Plant
42
Accessing Diagnostic Values
43
Inverter Diagnostic
43
Fig.: Inverter Details Graph
44
Fig.: Tracker Comparison Graph
45
Fig.: Module Field Comparison Graph
46
Battery Diagnostic
47
Fig.: Battery Diagnosis - Current Measurement Values
47
Fig.: Battery Diagnosis - Charging History 1-Day
48
Fig.: LCD Display with the Battery Symbol and One Element
50
Fig.: Battery Diagnosis - Balance
51
Accessing Event Logs
52
Fig.: the Event Log Is Being Loaded
52
Fig.: Event Log
52
Accessing Notifications
53
Fig.: Notification Overview
53
Fig.: Message with Text Field
54
Accessing Feed-In Management
55
Fig.: Feed-In Management - Control State
55
Fig.: Feed-In Management - Feed-Balance
61
Fig.: PM History
62
Accessing the SCB Monitor (Only Solar-Log 2000)
63
Accessing Components
64
Fig.: Components - S0 Meter on Interface a and B
64
Fig.: Alarm Contact
65
Fig.: Connection Test - Wireless Package
65
Smart Energy
67
Fig.: Smart Energy Status (Current)
69
Fig.: Smart Energy History - Example of Priority 1
70
Fig.: Smart Energy - Simulation with EGO - Surplus Priority 1
72
Accessing CSV Export
74
Fig.: CSV Export
74
Accessing Support
75
Fig.: Support - General
75
3 Notifications
76
Yield E-Mail
76
Fig.: Entering the Recipient's E-Mail Address
76
Fig.: Defining Notification Times and Setting Types
77
Explanation of the Individual E-Mail Functions
78
Fig.: Example of a Yield Message
78
Fig.: Yield Overview (All INV) in HTML Format
79
Fig.: Yield Overview (All INV & Groups) in HTML Format
79
Performance Monitoring
81
Fig.: Performance Monitoring: Example Plant with Two Inverters
81
Fig.: Configuring Module Fields
82
Fig.: Configuring Performance Monitoring
82
Performance Monitoring Notification
83
Fig.: Performance Monitoring with Notification and Inverter
84
Calculation and Explanation of the Notification
85
4 Operating the Solar-Log 1200 and 2000 Via Touch Display
86
Navigating from the Touch Screen
86
Fig.: Start Page of the Display
86
Accessing the Dashboard
88
Fig.: Dashboard View
88
Access Energy Flow
89
Fig.: Energy Flow View
89
Accessing the Energy Balance
90
Fig.: Energy Balance View
90
Start Smart Energy
91
Fig.: Smart Energy View
91
Accessing Forecast
92
Fig.: Forecast View
92
Accessing Yield History
93
Accessing Environmental Performance
93
Fig.: Yield History - Balance - Day
93
Fig.: Environmental Performance - Day View
93
Accessing the USB Menu
95
Fig.: Menu Settings
95
Fig.: USB Menu
95
5 Pac Correction Factor
97
Calculating the PAC Correction Factor
97
6 Using Solar-Log WEB
98
Registering for Solar-Log™ WEB "Classic 2Nd Edition
99
Fig.: C2 Registration
99
Accessing Plant Data
101
Fig.: C2 Registration Site
101
Fig.: C2 Plant Search Screen
102
Fig.: C2 Plant Search with a Filter
103
Fig.: C2 Plant with a Day Curve
105
Accessing Yield Data
106
How to Navigate between Different Overviews
106
The Meaning of the Values in the Overviews
106
Fig.: C2 Navigating in the View
106
Daily Overview
107
Fig.: Day Curve with Additional Values
107
Monthly Overview
109
Fig.: Plant C2 - Monthly Overview
109
Annual Overview
110
Fig.: Plant C2 - Annual Overview
110
Total Overview
111
Fig.: Plant C2 - Total Overview
111
Accessing and Filtering the Event Log
112
Fig.: Plant C2 - Notifications
112
Fig.: Plant C2 - Notifications Filtered by Day
113
7 Cleaning and Care
114
Cleaning Tips
114
Care Tips
114
8 Notifications on the LCD Status Display (Solar-Log 300, 1200 and 2000)
115
Meaning of the Symbols on the LCD Display
115
Fig.: LCD Status Display with All of the Symbols
115
9 Disposal
118
List of Figures 11 List of Figures
125
Related product manuals
Solar-Log 1200
319 pages
Solar-Log 200
319 pages
Solar-Log 300
158 pages
Solar-Log 2000
319 pages
Solar-Log PRO380-CT
4 pages
Solar-Log Pro 380
4 pages
Solar-Log 500
319 pages
Solar-Log 250
319 pages