17
Operating via a web browser within your own network
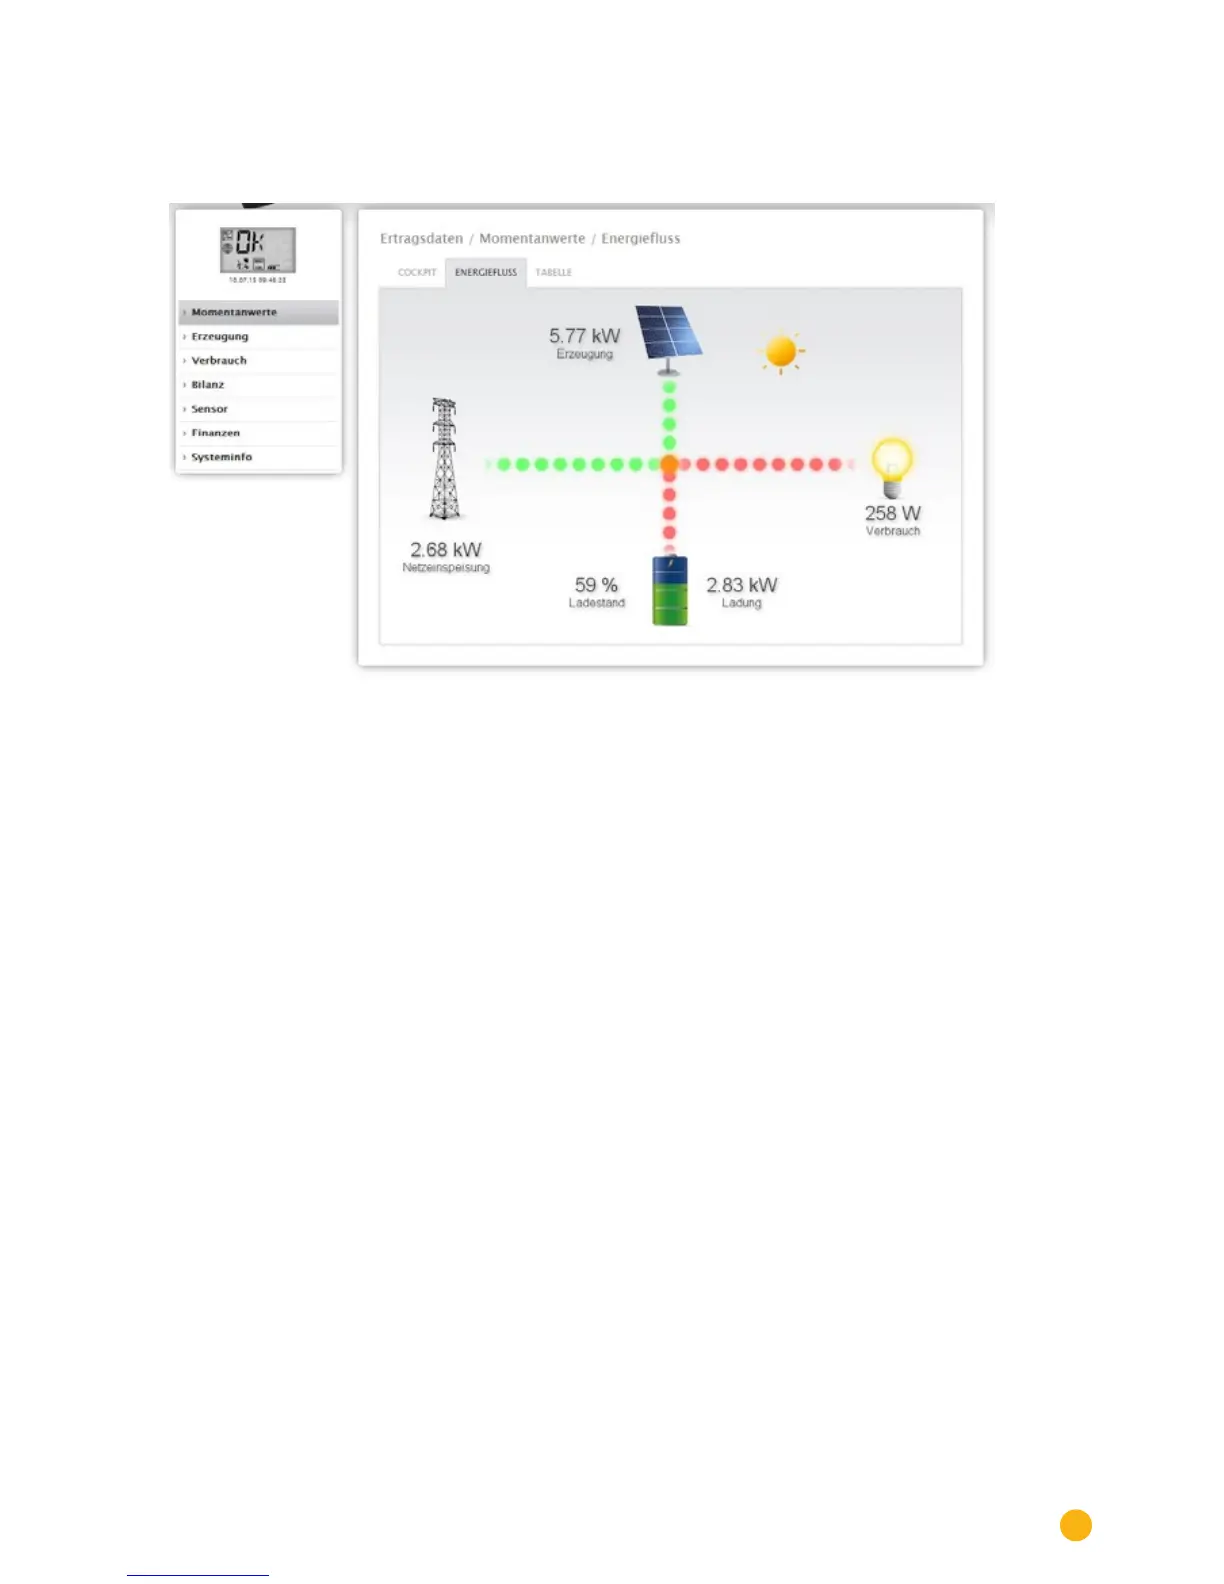
2.4.2 Energy flow
The plant is displayed as a flow graphic in the Energy flow tab.
Fig.: Example of a plant with an energy ow
Depending on the particular devices connected, the following values are displayed in the flow graphic in
real time:
•
Production (W)
•
Consumption (W)
•
Grid fed / purchase from grid (W)
•
Battery Status
• Charge Status (%)
• Charge / Discharge Output (W)
Note:
When a battery meter is connected, the value for the battery's charge status cannot be read. That is
why for the presentation of energy flows that the charge status is displayed with n/a and the charge
with 0 W.
Energy Flow Color Key
•
Production (W):
• Green, energy is being generated.
• Gray, energy production is not active.
•
Consumption (W):
• Red, energy is being consumed.
• Grey, no active consumption.
•
Grid fed / purchase from grid (W)
• Red, energy is being purchased from the grid.
• Green, energy is being fed into the grid.
• Gray, no energy transfer in either direction with the grid.
Battery:
•
Charge Level (%):
• Red, battery is being charged.
•
Discharge (W)
• Green, battery is being discharged.