62
Operating via a web browser within your own network
The Feed-balance tab displays when there was a grid feed and when electricity was purchased from the
grid. Negative values mean that the power was purchased from the grid and positive values mean that
power was fed into the grid.
Move the mouse cursor over the black line to display the following values for the power reductions:
•
Time
•
Percentage (%DC)
•
Watt
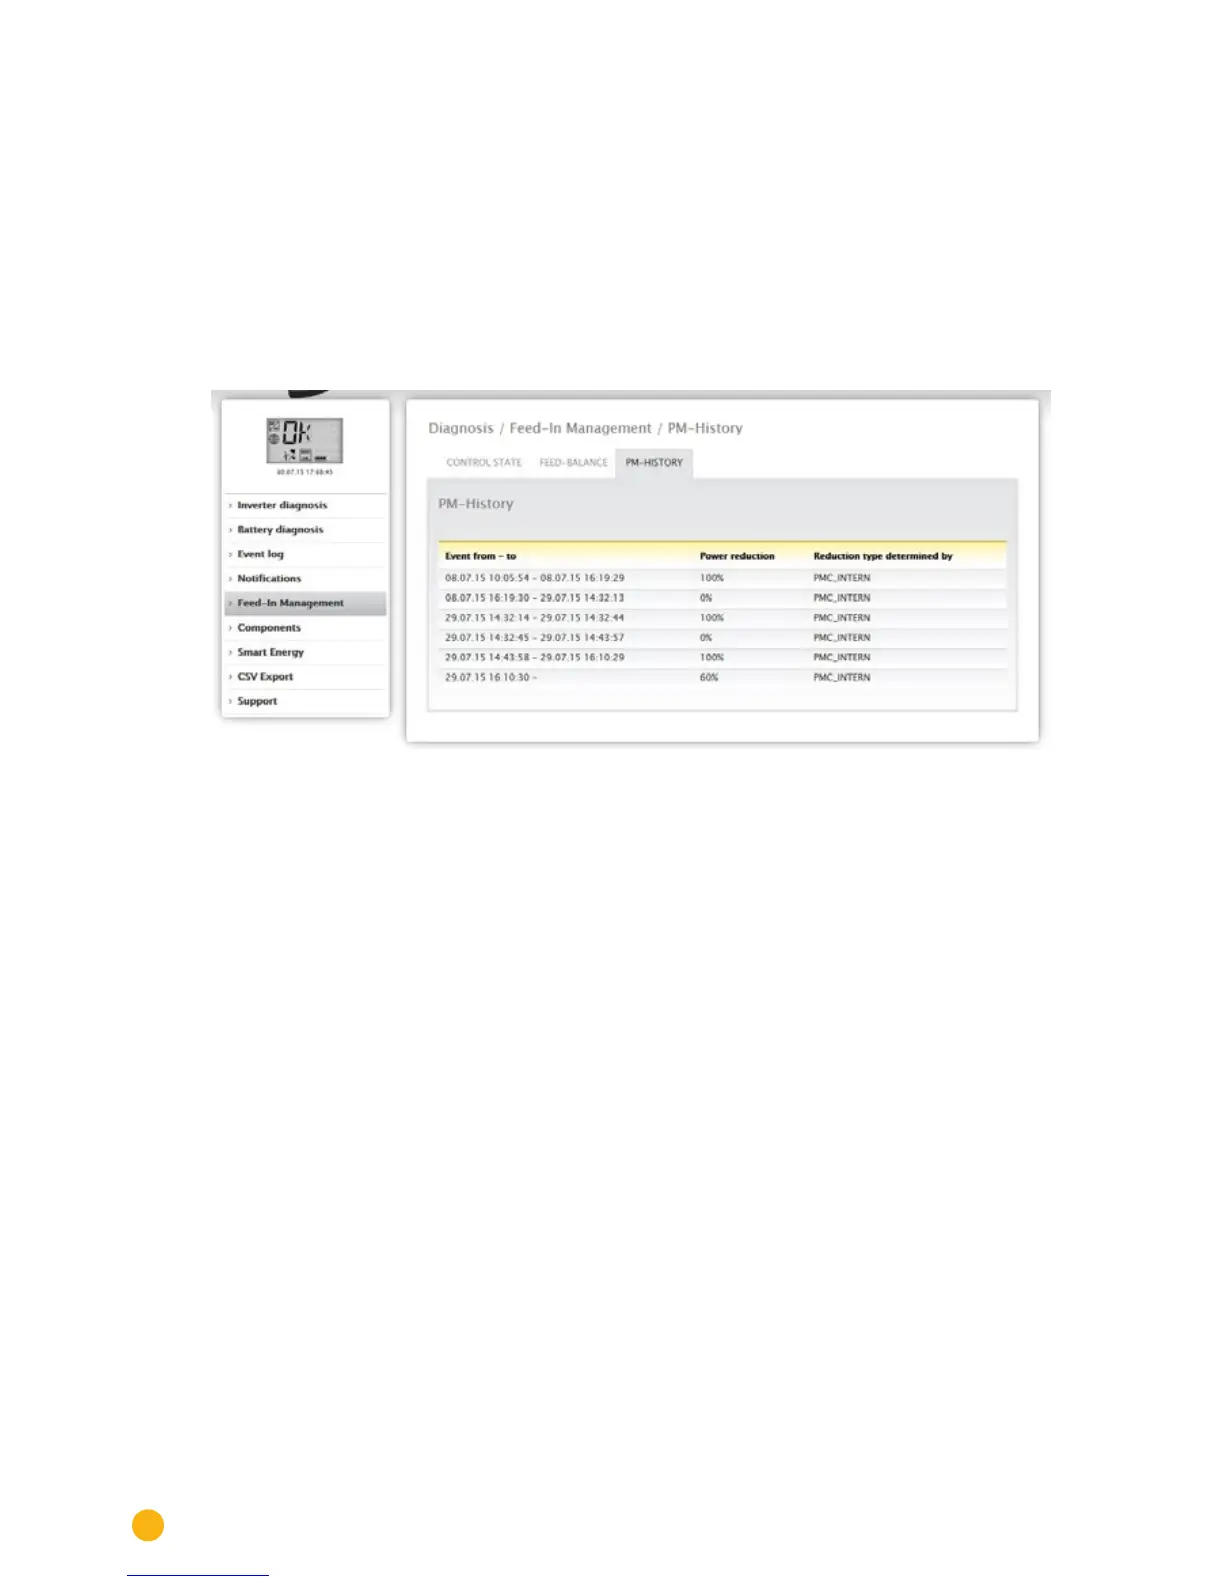
PM History
The power reductions are displayed in a table with three columns in the PM History tab.
Fig.: PM History
•
Event from - to:
• The time and date that a power reduction was activated.
•
Power reduction type determined by:
Possible values in this column:
• PMC_NONE
• PMC_DIAG
• PMC_MODBUS_2
• PMC_MODBUS_1
• PMC_PROFILE
• PMC_INTERN
• PMC_DIRECTM
(For an explanation, refer to the section: "
Explanation of the Values in the Power Reduction " in
the table "
Power reduction type determined by").
•
Power reduction:
• The power reduction as a percentage.
Two additional tabs can be accessed in the Feed-In Management menu (as long as the devices are con-
nected):
•
Utility Meter
•
I/O Box
There is a detailed guide for this in the Feed-In Management chapter of the Installation Manual.
 Loading...