87
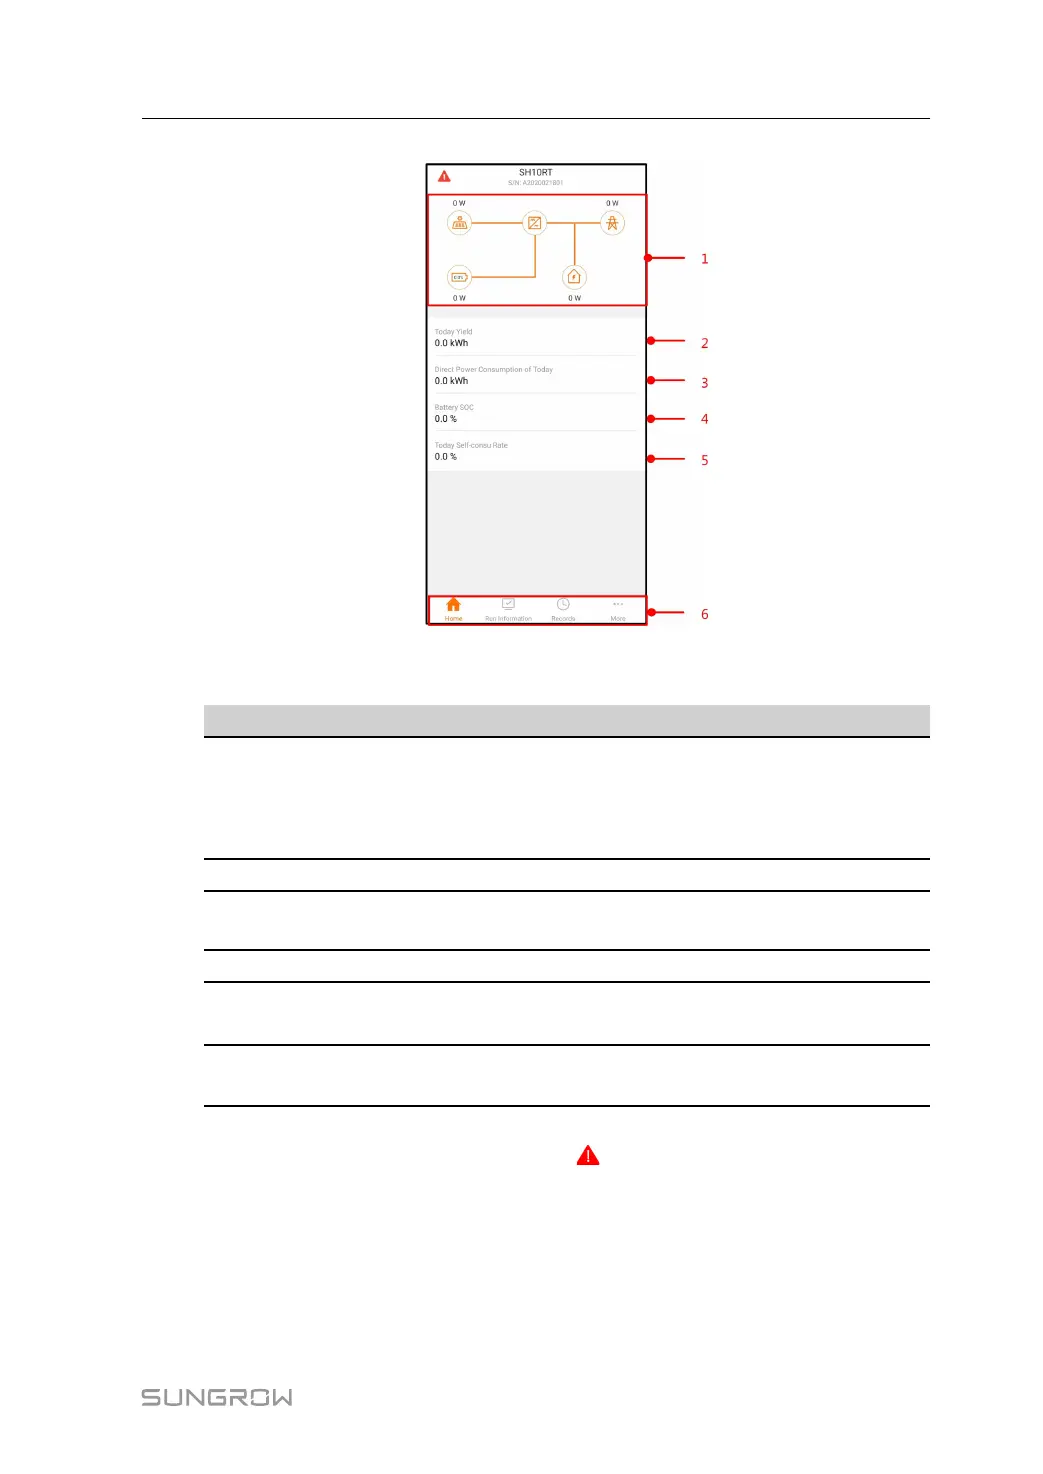
figure 8-7 Home
table 8-5 Home page description
No. Name
Description
1 Load flow chart
Shows the PV power generation power, feed-in
power, etc. The line with an arrow indicates energy
flow between connected devices, and the arrow
pointing indicates energy flow direction.
2
Today yield
Shows today power generation of the inverter
3
Direct Power Con-
sumption of Today
Shows electricity directly consumed by loads today
4
Battery SOC
Indicates remaining battery capacity
5
Today Self-consu
Rate
Indicates today self-consumption rate of the PV
system
6
Navigation bar
Includes menus of Home, Run Information, Re-
cords, and More.
If the inverter runs abnormally, the fault icon
appears on the upper left corner of the
screen. Users can tap the icon to view detailed fault information and corrective measures.
8.8 Run Information
Tap Run Information on the navigation bar to enter the corresponding screen, as shown in
the following figure.
User Manual 8 iSolarCloud App