Website: www.sunsynk.com E-mail: sales@globaltech-china.com
34
Battery Column: Shows total power from the battery, battery SOC, battery voltage, battery current (negative
means charge, positive means discharge) battery temperature (shows zero if the battery temperature sensor
is not connected). DC transformer temperature and AC heatsink temperature (When the temperature reaches
90°C it will show in red and start deteriorating when it reaches 110°C. Next, the inverter will shut down to
allow it to cool and reduce its temperature.
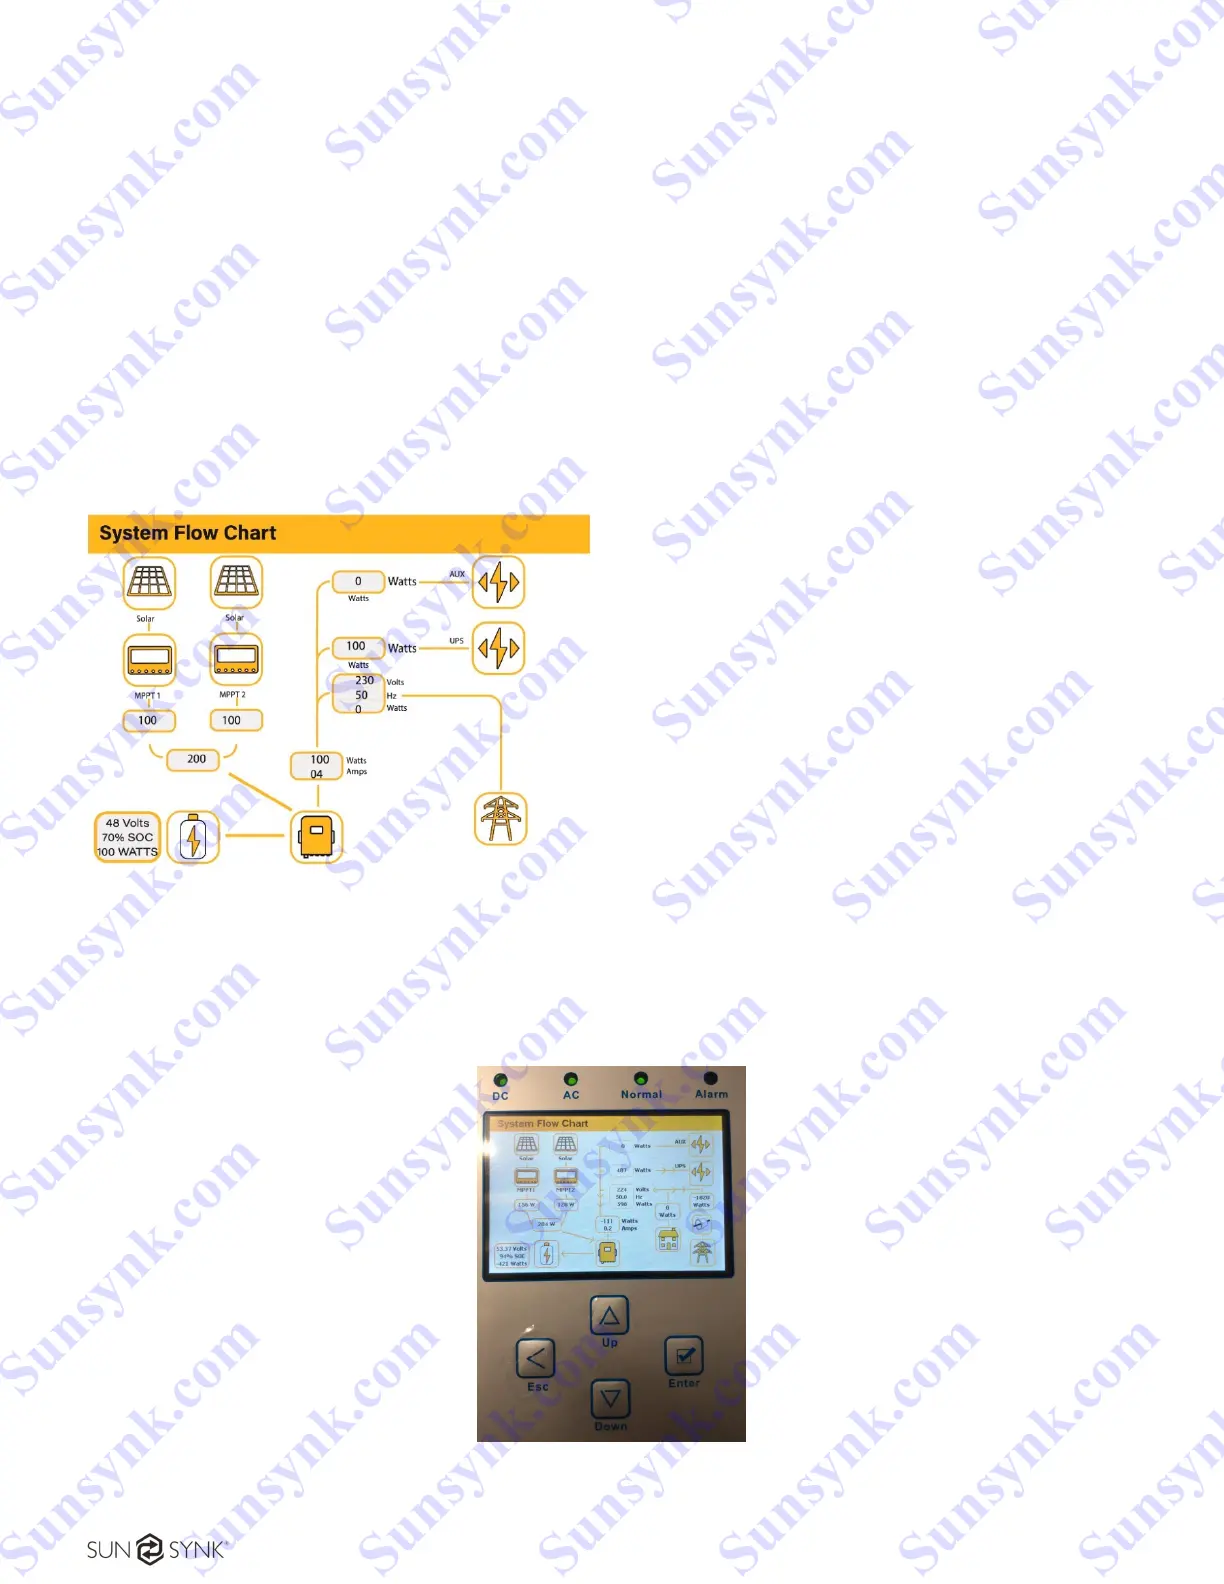
5.2. SYSTEM FLOW PAGE
Access by clicking on the bar chart on the home page.
The System Flow Page is one of the most useful pages to understand what the inverter is doing at a
glance. You can clearly see the status of charge and discharge, the battery condition, the exact current flow.
This is a very useful screen and it is unique to the Sunsynk product.
Figure 32 - Interface with the flow chart.
What this page displays:
The system flow.
MPPTs power.
Battery status.
Power distribution to load or grid.
Sunsynk.com Sunsynk.com Sunsynk.com Sunsynk.com
Sunsynk.com Sunsynk.com Sunsynk.com Sunsynk.com
Sunsynk.com Sunsynk.com Sunsynk.com Sunsynk.com
Sunsynk.com Sunsynk.com Sunsynk.com Sunsynk.com
Sunsynk.com Sunsynk.com Sunsynk.com
Sunsynk.com Sunsynk.com Sunsynk.com
Sunsynk.com Sunsynk.com
Sunsynk.com Sunsynk.com
Sunsynk.com
Sunsynk.com
Sunsynk.com Sunsynk.com Sunsynk.com Sunsynk.com
Sunsynk.com Sunsynk.com Sunsynk.com
Sunsynk.com Sunsynk.com Sunsynk.com
Sunsynk.com Sunsynk.com
Sunsynk.com Sunsynk.com
Sunsynk.com
Sunsynk.com