Contents
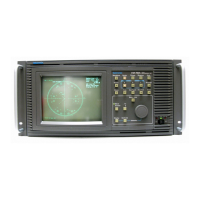
1502C MTDR Service Manual
v
Figure 5–20: Shift Register 5–36. . . . . . . . . . . . . . . . . . . . . . . . . . . . . . . . . .
Figure 5–21: CPU and Display Memory Interface 5–39. . . . . . . . . . . . . . . .
Figure 6–1: Typical Start-Up Display 6–2. . . . . . . . . . . . . . . . . . . . . . . . .
Figure 6–2: Waveform on the Display 6–2. . . . . . . . . . . . . . . . . . . . . . . .
Figure 6–3: Setup Menu 6–3. . . . . . . . . . . . . . . . . . . . . . . . . . . . . . . . . . .
Figure 6–4: Main Menu 6–4. . . . . . . . . . . . . . . . . . . . . . . . . . . . . . . . . . .
Figure 6–5: Diagnostics Menu 6–5. . . . . . . . . . . . . . . . . . . . . . . . . . . . . .
Figure 6–6: Front Panel Diagnostic Display 6–5. . . . . . . . . . . . . . . . . . . .
Figure 6–7: Front Panel Diagnostic Display 6–6. . . . . . . . . . . . . . . . . . . .
Figure 6–8: Front Panel Diagnostic Display 6–6. . . . . . . . . . . . . . . . . . . .
Figure 6–9: Front Panel Diagnostic Display 6–7. . . . . . . . . . . . . . . . . . . .
Figure 6–10: Waveform on the Display with No Cable Attached 6–8. . . .
Figure 6–11: Display with 3-ft Cable and Stored Waveform 6–8. . . . . . . .
Figure 6–12: Cursor on Rising Edge of Pulse 6–9. . . . . . . . . . . . . . . . . . .
Figure 6–13: Cursor at 0.000 ft n 6–9. . . . . . . . . . . . . . . . . . . . . . . . . . . . .
Figure 6–14: Cursor on Rising Edge of Pulse 6–9. . . . . . . . . . . . . . . . . . .
Figure 6–15: Flatline Display to >2,000 ft 6–10. . . . . . . . . . . . . . . . . . . . . .
Figure 6–16: Incident Pulse at –2.000 ft 6–11. . . . . . . . . . . . . . . . . . . . . . . .
Figure 6–17: Incident Pulse at –2.000 ft with 3-ft Cable Connected 6–11. .
Figure 6–18: Incident Pulse at –2.000 ft with Max Hold 6–11. . . . . . . . . . .
Figure 6–19: Waveform at Top of the Display 6–12. . . . . . . . . . . . . . . . . .
Figure 6–20: Waveform at Bottom of the Display 6–13. . . . . . . . . . . . . . . .
Figure 6–21: Waveform at Centered 6–13. . . . . . . . . . . . . . . . . . . . . . . . . . .
Figure 6–22: Cursor Moved to 100.000 ft 6–14. . . . . . . . . . . . . . . . . . . . . .
Figure 6–23: Noise with Gain at 5.00 m
r
6–14. . . . . . . . . . . . . . . . . . . . . .
Figure 6–24: Noise Diagnostic Display 6–15. . . . . . . . . . . . . . . . . . . . . . . .
Figure 6–25: Service Diagnostic Menu 6–15. . . . . . . . . . . . . . . . . . . . . . . .
Figure 6–26: Sampling Efficiency Diagnostic 6–16. . . . . . . . . . . . . . . . . . .
Figure 6–27: Service Diagnostic Menu 6–16. . . . . . . . . . . . . . . . . . . . . . . .
Figure 6–28: Service Diagnostic Menu 6–17. . . . . . . . . . . . . . . . . . . . . . . .
Figure 6–29: Waveform with Cursor at –2.000 ft 6–18. . . . . . . . . . . . . . . . .
Figure 6–30: Waveform at 50 m
r
/div 6–18. . . . . . . . . . . . . . . . . . . . . . . . .
Figure 6–31: Waveform at 5 m
r
/div 6–19. . . . . . . . . . . . . . . . . . . . . . . . . .
Figure 6–32: Incident Pulse at Center of Display 6–19. . . . . . . . . . . . . . . . .
Figure 6–33: Incident Pulse Centered, Vertical Increased 6–20. . . . . . . . . .
Figure 6–34: Cursor on Rising Edge at First Horizontal Graticule 6–20. . .
Figure 6–35: Cursor on Rising Edge at Last Horizontal Graticule 6–21. . .
Figure 6–36: Rising Edge at Center of Display 6–22. . . . . . . . . . . . . . . . . .
Artisan Technology Group - Quality Instrumentation ... Guaranteed | (888) 88-SOURCE | www.artisantg.com
 Loading...
