Calibration
1502C MTDR Service Manual
6–15
Noise Diagnostic
Continuous Result Update
Acceptable Range Result
0 – 11 Pixels 4
vertical scale at 5.00 m
r
and cursor at location to sample.
– Push MENU button to Exit –
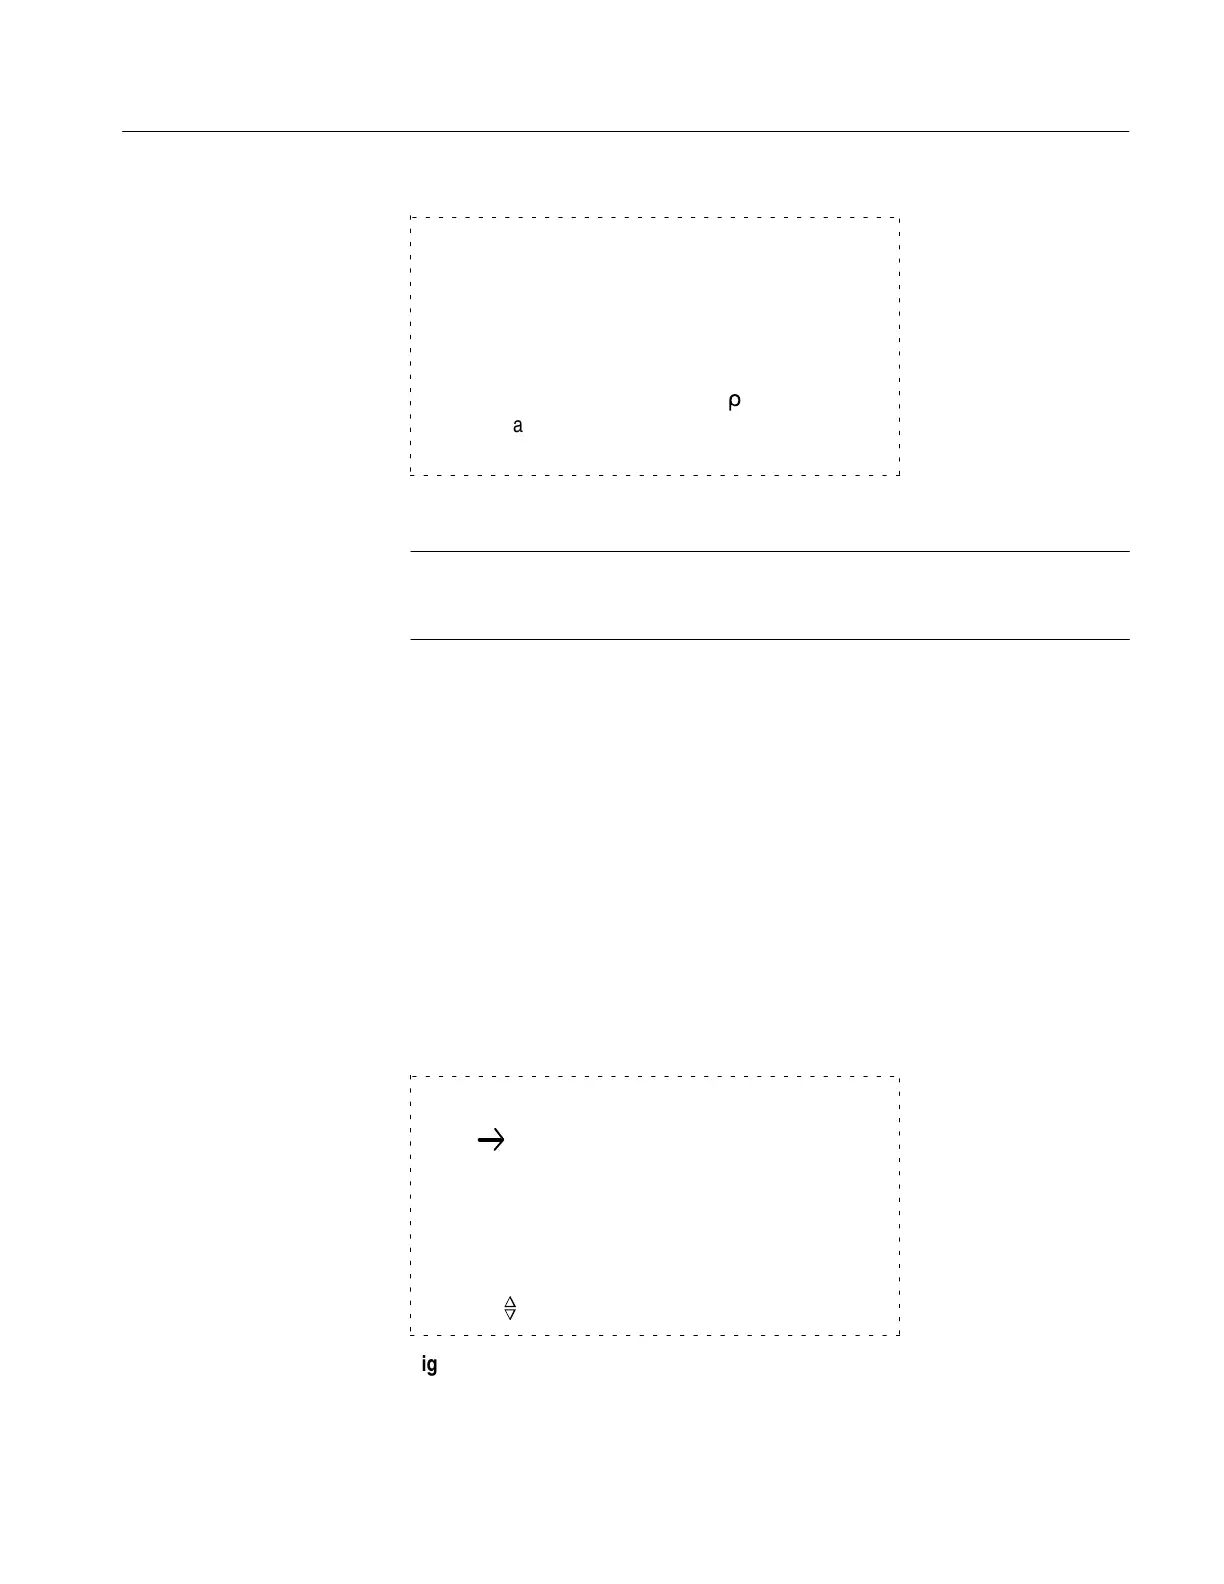
Figure 6–24: Noise Diagnostic Display
NOTE. If the instrument does not meet this specification, refer to the Circuit
Descriptions chapter and the Troubleshooting section of the Maintenance chapter
of this manual.
11. Press MENU once to return to the Service Diagnostic Menu. Do not exit from
the Service Diagnostic Menu because you will use it in the next check.
Sampling Efficiency Check
If the instrument fails this check, the waveforms might not look normal. If the
efficiency is more than 100%, the waveforms will appear noisy. If the efficiency is
below the lower limit, the waveform will take longer (more pixels) to move from
the bottom to the top of the reflected pulse. This smoothing effect might completely
hide some events that would normally only be one or two pixels wide on the display.
1. While in the Service Diagnostic Menu, select the Sampling Efficiency
Diagnostic and follow the directions shown on the display.
Exit Service Diagnostic Menu
Sampling Efficiency Diagnostic
Noise Diagnostic
Impedance Diagnostic
Offset/Gain Diagnostic
RAM/ROM Diagnostics
Timebase is: Normal – Auto Correction
Move Position to select, then push MENU button
n
o
Figure 6–25: Service Diagnostic Menu
Artisan Technology Group - Quality Instrumentation ... Guaranteed | (888) 88-SOURCE | www.artisantg.com
 Loading...
