13 testo DataControl PC software
114
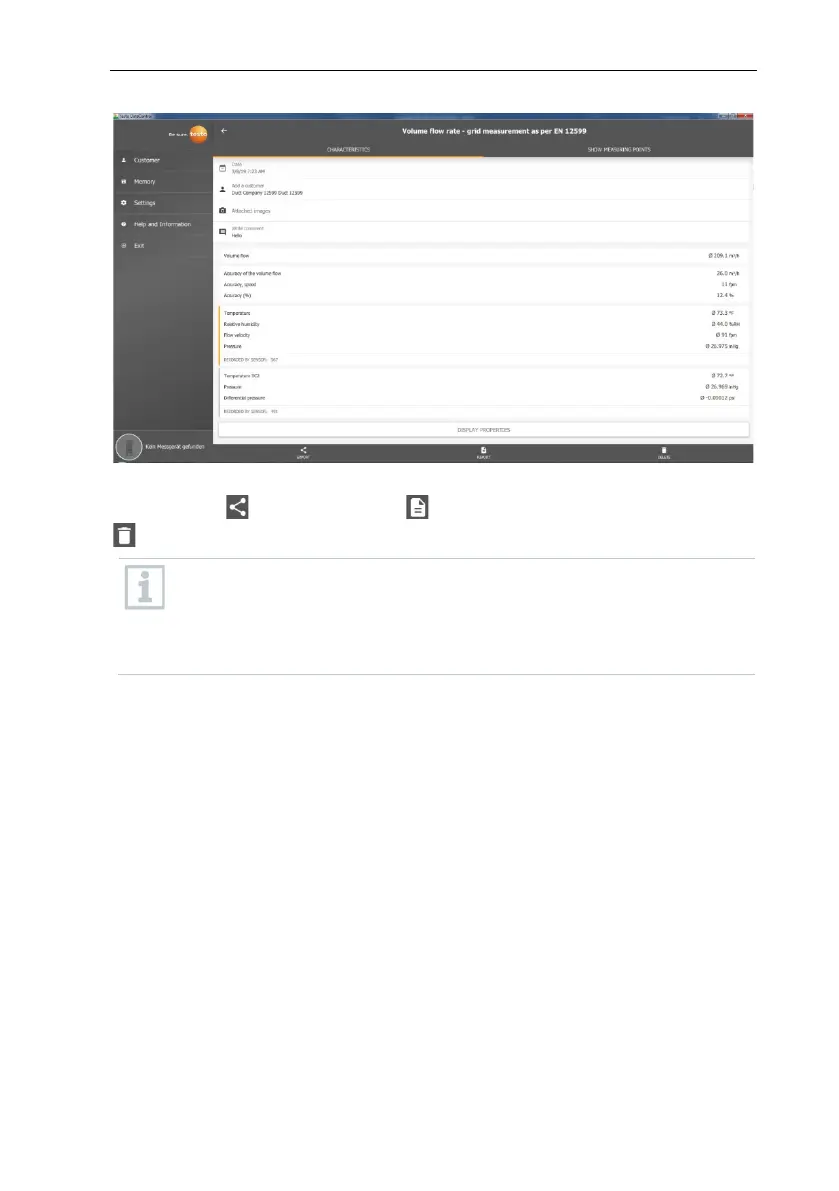
Via the three icons in the footer, the measurement results can be saved as a
.csv /.json file or as a PDF report on the computer or permanently deleted
.
When creating a PDF report, there is the option, as on the testo 400, to
include only the average measuring values or to integrate all measured
values in the report.
Creating large PDF reports (with over 100,000 readings) can take a few
minutes. The time may vary depending on PC performance.
13.8.2 Graphic view
In the Graphic tab, corresponding values are located along the chronological
trend graph of the measurement for up to four selected measurement
parameters. Each of the four channels contains the three-digit probe ID and the
unit of the selected measurement parameter. The colour of the individual
channels is reflected in the corresponding Y-axes and trend graphs in each
case. If you move the mouse pointer along the graphic, the exact time and
measuring values of all channels will be displayed for the corresponding time
point.