9 Operation
73
The other measuring values are assigned to the corresponding probes.
The probes relevant to the application menu are highlighted in orange,
while the other probes, which have stored additional measuring values
during the measurement, are highlighted in grey. After the probes, the
Actual measuring period is displayed. This
always starts at the time of
the first recorded measuring value and ends with the last recorded
measuring value. If, for example, a 60-minute measurement were
terminated prematurely, the measurement properties would indicate
that the measurement period is 60 minutes, but in the case of the
Actual measuring period, the correct measurement period will be
calculated and displayed.
At the bottom of the screen, following all the listed measuring values,
the Display Properties and Show Values tabs are listed, in all the
measurement menus. In addition, the Graphic tab is displayed for
PMV/PPD measurements. The graphic progression of the individual
measurements can be called up at any time in the testo DataControl
software (see Section 13.8.2). For HVAC grid measurements in
accordance with EN 12599 or ASHRAE, the gauged Measuring Points
and not the measuring values are listed generally.
Properties
lists the settings that the measurement was carried out with,
along with all the individual elements (measuring mode, duct
dimensions, correction factor, etc.). In the second menu item, all
measuring values of the various measurement parameters are listed
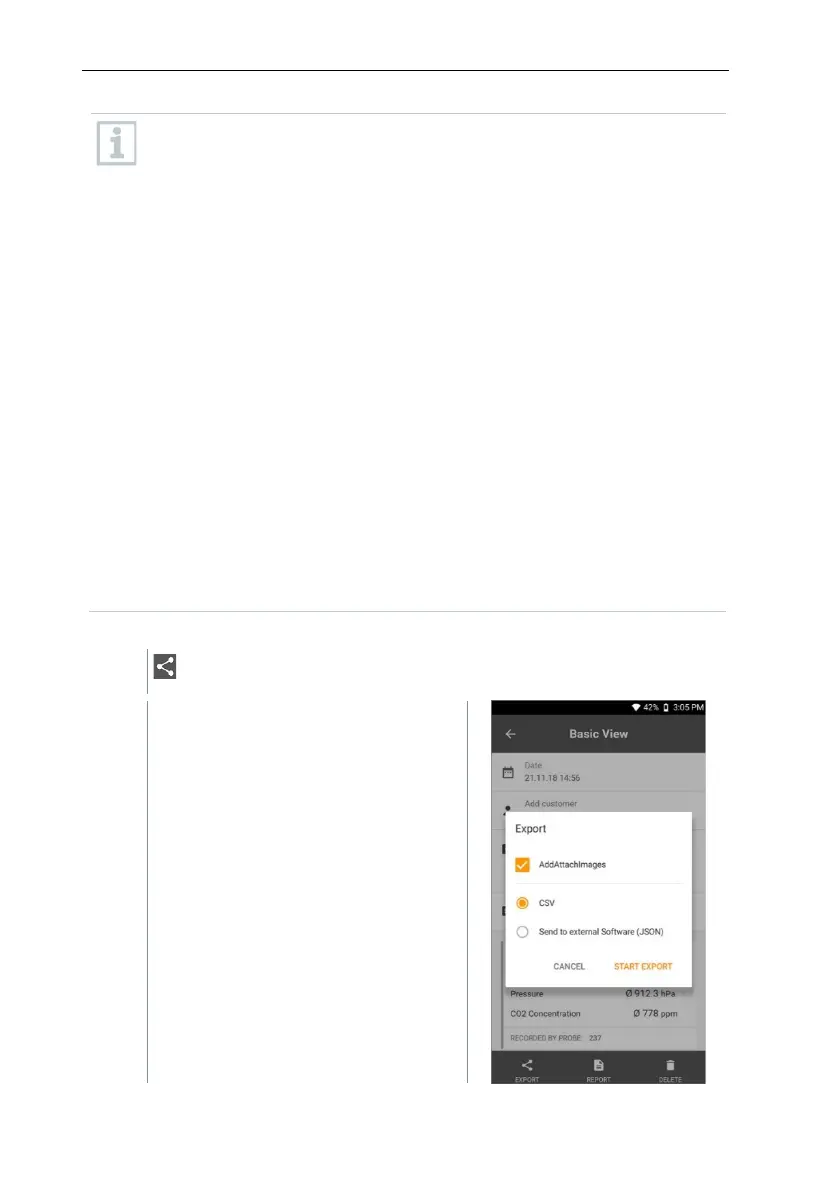
Sending a report
Click on Export.
A selection window is displayed, and
the measurement report can be
exported as a CSV or JSON file.