114 TI-Nspire™ Reference Guide
zTest
Catalog
>
zTest m0,s,List,[Freq[,Hypoth]]
(Data list input)
zTest m0,s,v,n[,Hypoth]
(Summary stats input)
Performs a z test with frequency freqlist. A summary of results is
stored in the stat.results variable. (See page 97.)
Test H
0
: m = m0, against one of the following:
For H
a
: m < m0, set Hypoth<0
For H
a
: m ƒ m0 (default), set Hypoth=0
For H
a
: m > m0, set Hypoth>0
For information on the effect of empty elements in a list, see “Empty
(void) elements” on page 131.
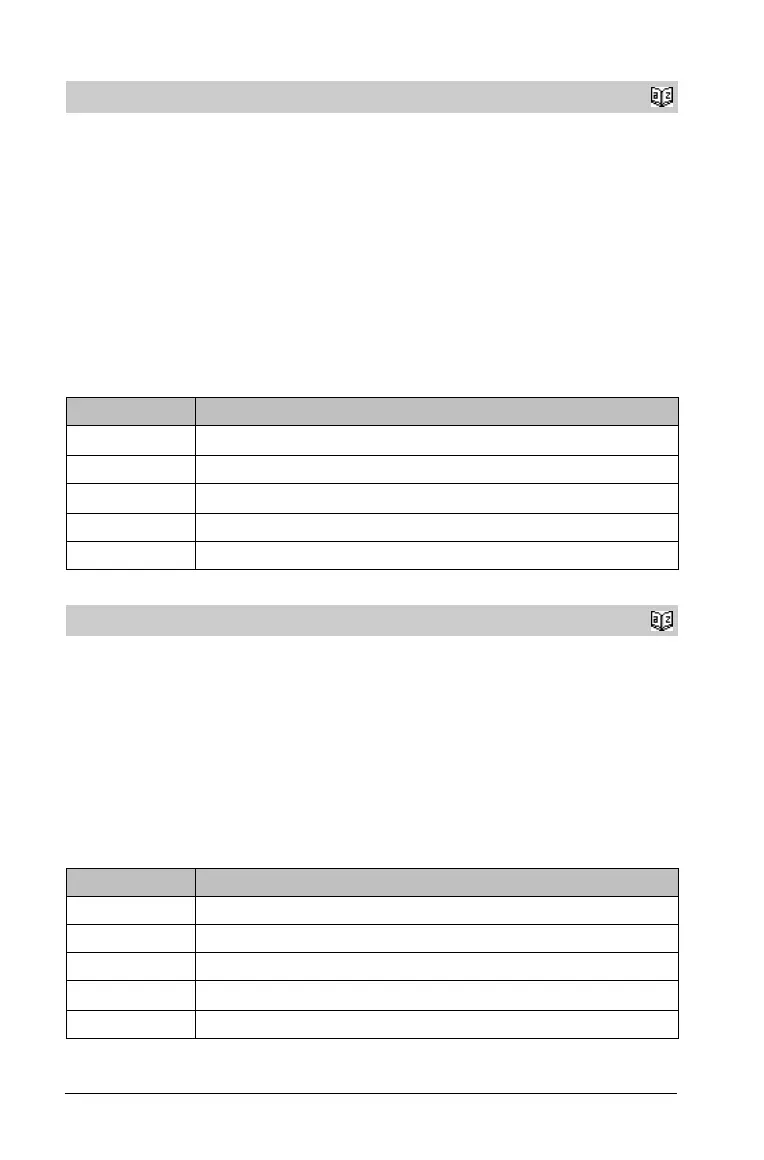
Output variable Description
stat.z
(x N m
0
) / (s / sqrt(n))
stat.P Value Least probability at which the null hypothesis can be rejected
stat.x
Sample mean of the data sequence in List
stat.sx Sample standard deviation of the data sequence. Only returned for Data input.
stat.n Size of the sample
zTest_1Prop
Catalog
>
zTest_1Prop p0,x,n[,Hypoth]
Computes a one-proportion z test. A summary of results is stored in
the stat.results variable. (See page 97.)
x is a non-negative integer.
Test H
0
: p = p0 against one of the following:
For H
a
: p > p0, set Hypoth>0
For H
a
: p ƒ p0 (default), set Hypoth=0
For H
a
: p < p0, set Hypoth<0
For information on the effect of empty elements in a list, see “Empty
(void) elements” on page 131.
Output variable Description
stat.p0 Hypothesized population proportion
stat.z Standard normal value computed for the proportion
stat.PVal Smallest level of significance at which the null hypothesis can be rejected
stat.Ç
Estimated sample proportion
stat.n Size of the sample

 Loading...


