TI-Nspire™ Reference Guide 35
exp()
u key
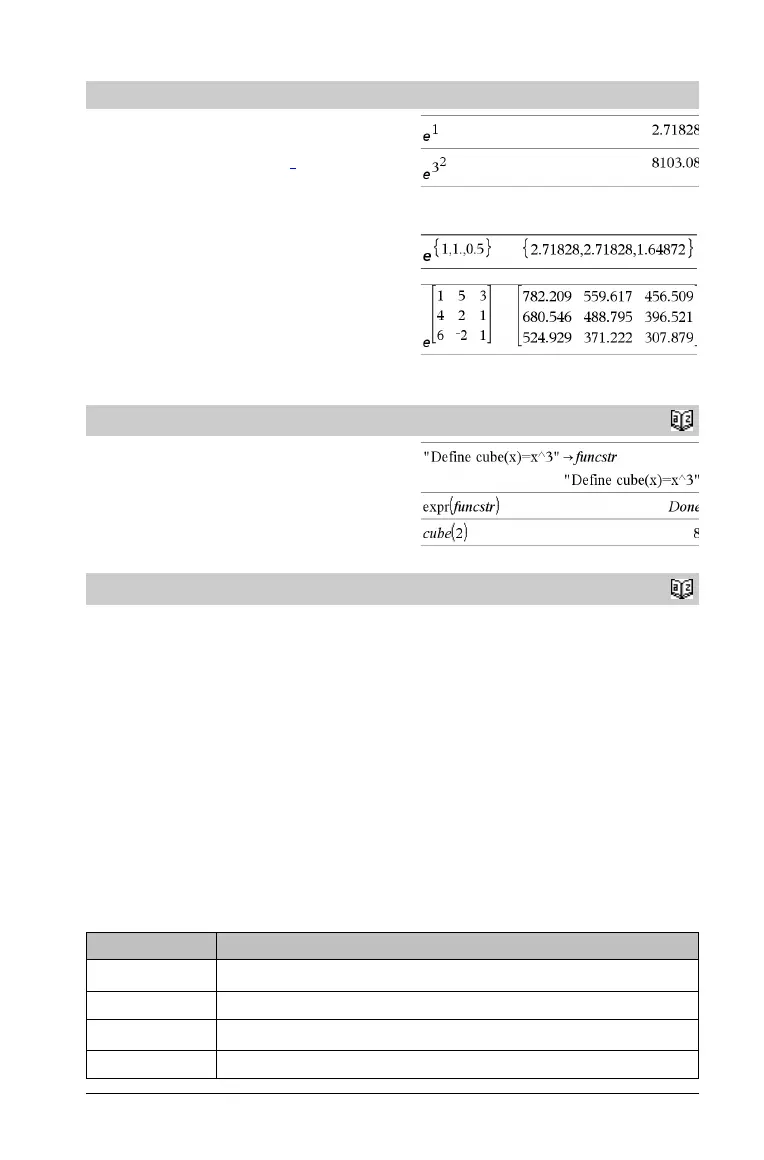
exp(Va lu e 1) ⇒ value
Returns e raised to the Va l ue 1 power.
Note: See also e exponent template, page 2.
You can enter a complex number in re
i q
polar form. However, use this
form in Radian angle mode only; it causes a Domain error in Degree
or Gradian angle mode.
exp(List1) ⇒ list
Returns
e raised to the power of each element in List1.
exp(squareMatrix1) ⇒ squareMatrix
Returns the matrix exponential of squareMatrix1. This is not the
same as calculating e raised to the power of each element. For
information about the calculation method, refer to cos().
squareMatrix1 must be diagonalizable. The result always contains
floating-point numbers.
expr()
Catalog
>
expr(String) ⇒ expression
Returns the character string contained in String as an expression and
immediately executes it.
ExpReg
Catalog
>
ExpReg X, Y [, [Freq] [, Category, Include]]
Computes the exponential regression y = a·(b)
x
on lists X and Y
with frequency Freq. A summary of results is stored in the
stat.results variable. (See page 97.)
All the lists must have equal dimension except for Include.
X and Y are lists of independent and dependent variables.
Freq is an optional list of frequency values. Each element in Freq
specifies the frequency of occurrence for each corresponding X and Y
data point. The default value is 1. All elements must be integers | 0.
Category is a list of numeric or string category codes for the
corresponding X and Y data.
Include is a list of one or more of the category codes. Only those data
items whose category code is included in this list are included in the
calculation.
For information on the effect of empty elements in a list, see “Empty
(void) elements” on page 131.
Output variable Description
stat.RegEqn
Regression equation: a·(b)
x
stat.a, stat.b Regression coefficients
stat.r
2
Coefficient of linear determination for transformed data
stat.r Correlation coefficient for transformed data (x, ln(y))

 Loading...


