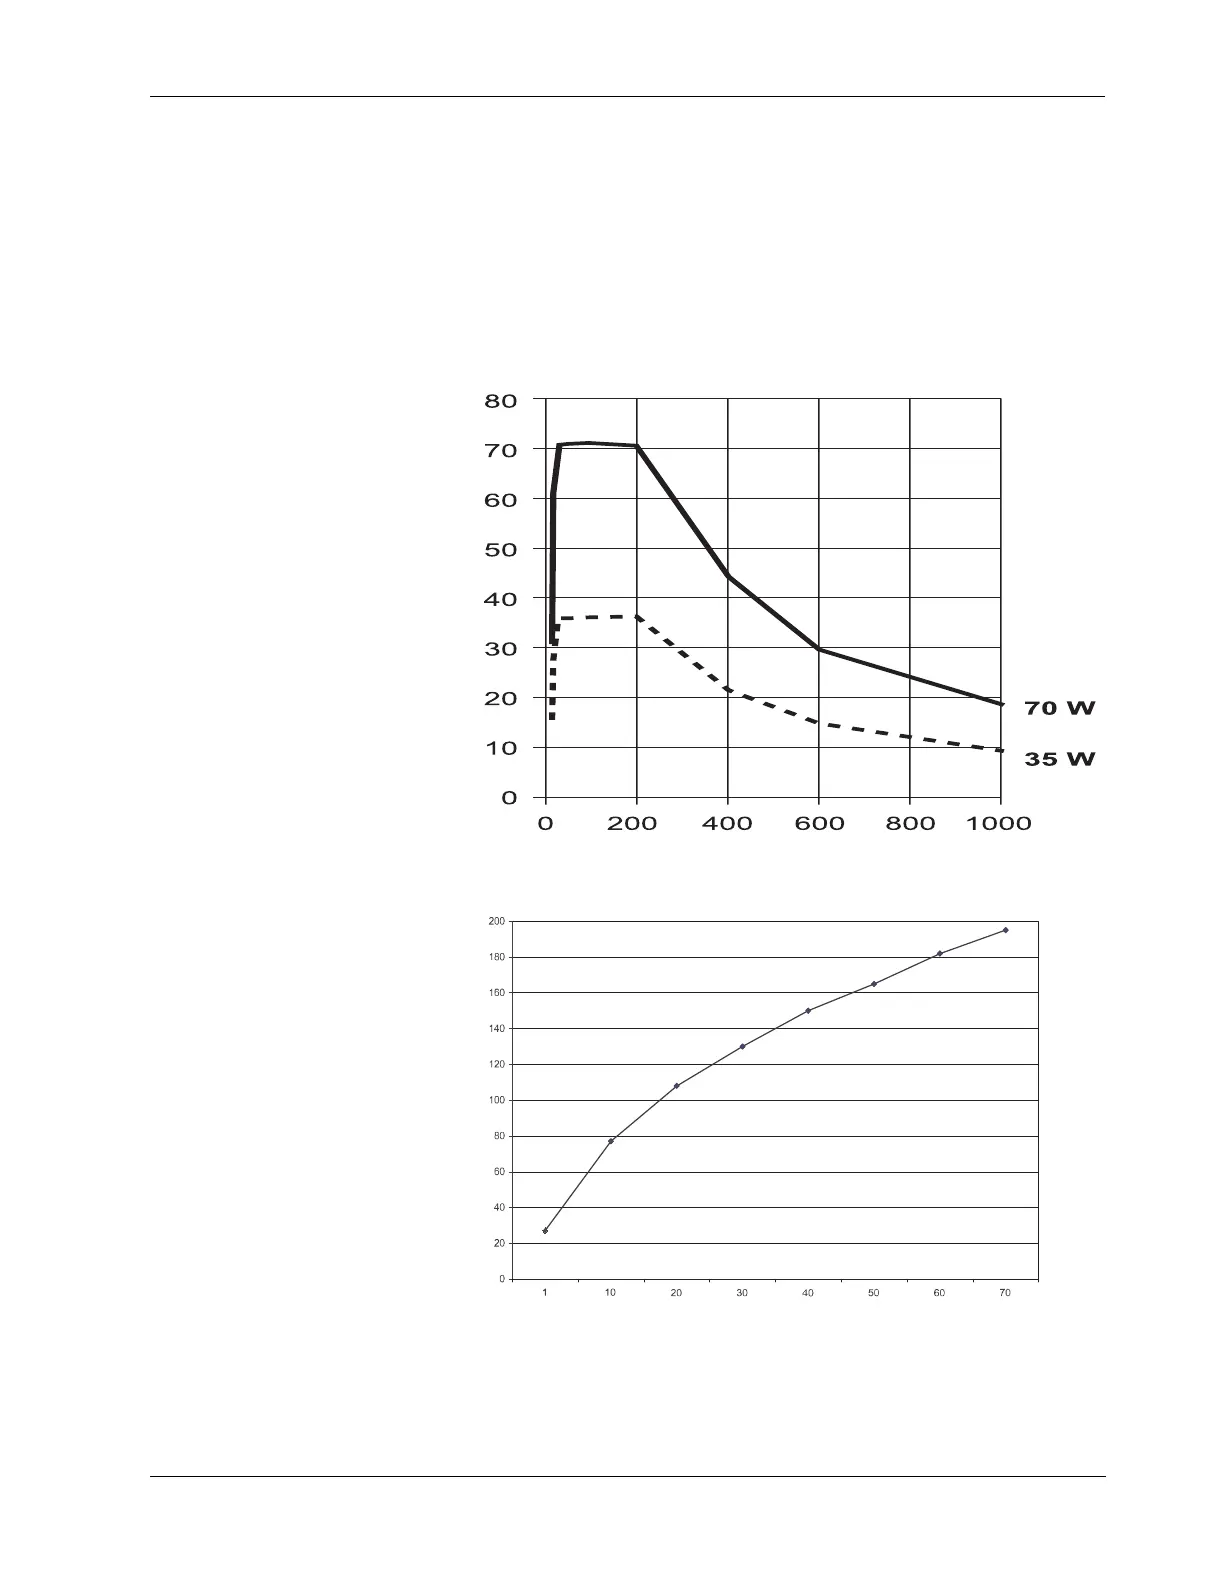
Output Power vs. Resistance Graphs
3-14 Force FX-8C Service Manual
Output Power vs. Resistance Graphs
The graphs that follow depict the changes for each mode at specific power
settings.
Bipolar Graphs
The insulating surface described in IEC 601-2-2 was used to obtain the
bipolar output measurements.
Figure 3-1.
Output power versus impedance for
Precise bipolar mode
Figure 3-2.
Precise bipolar mode—
output power vs. peak voltage
Load Resistance (ohms)
Output Power (watts)
Output Power (watts)
Open Circuit Peak Voltage (volts)