Output Power vs. Resistance Graphs
Technical Specifications
Force FX-8C Service Manual 3-17
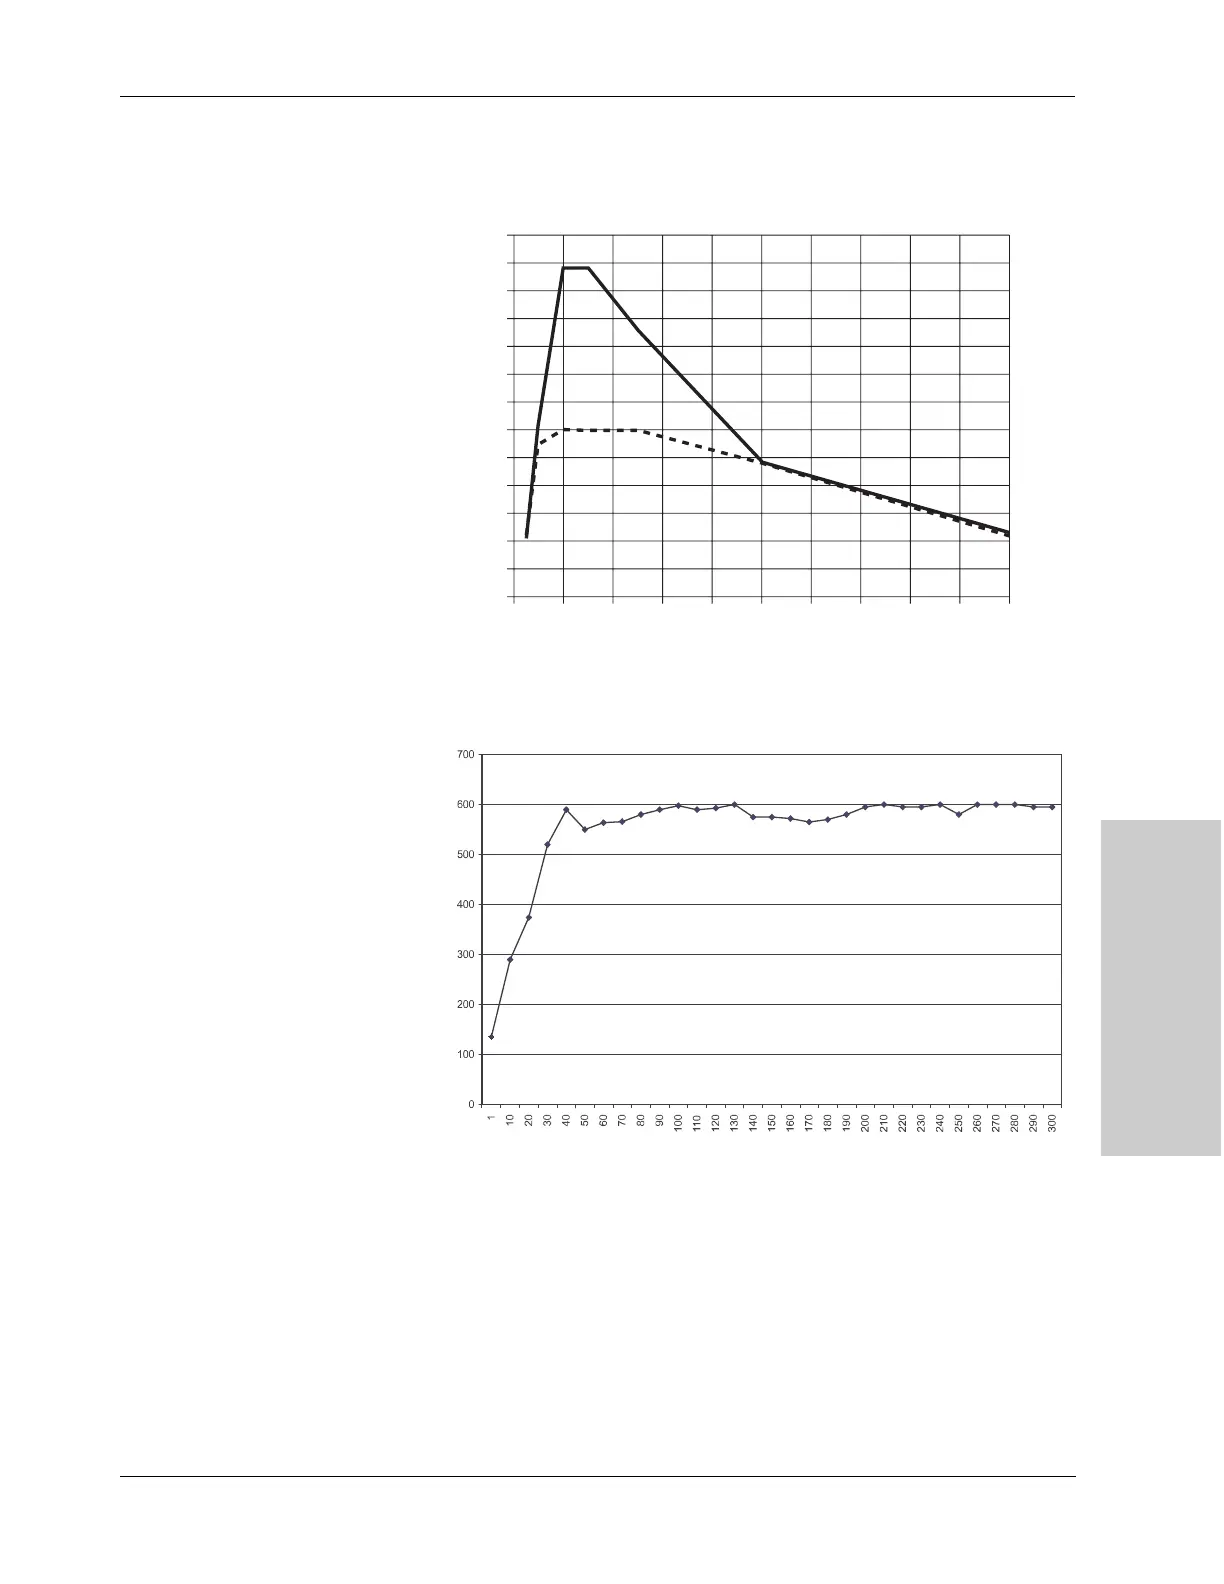
Monopolar Cut Graphs
These measurements were taken using short (< 0.5 meter) leads.
Figure 3-7.
Output power versus impedance for
Low cut mode
Figure 3-8.
Low cut mode—
output power vs. peak voltage
0 200 400 600 800 1000 1200 1400 1600 1800 2000
325
300
275
250
225
200
175
150
125
100
75
50
25
0
300 W
150 W
Load Resistance (ohms)
Output Power (watts)
Output Power (watts)
Open Circuit Peak Voltage (volts)