Output Power vs. Resistance Graphs
3-20 Force FX-8C Service Manual
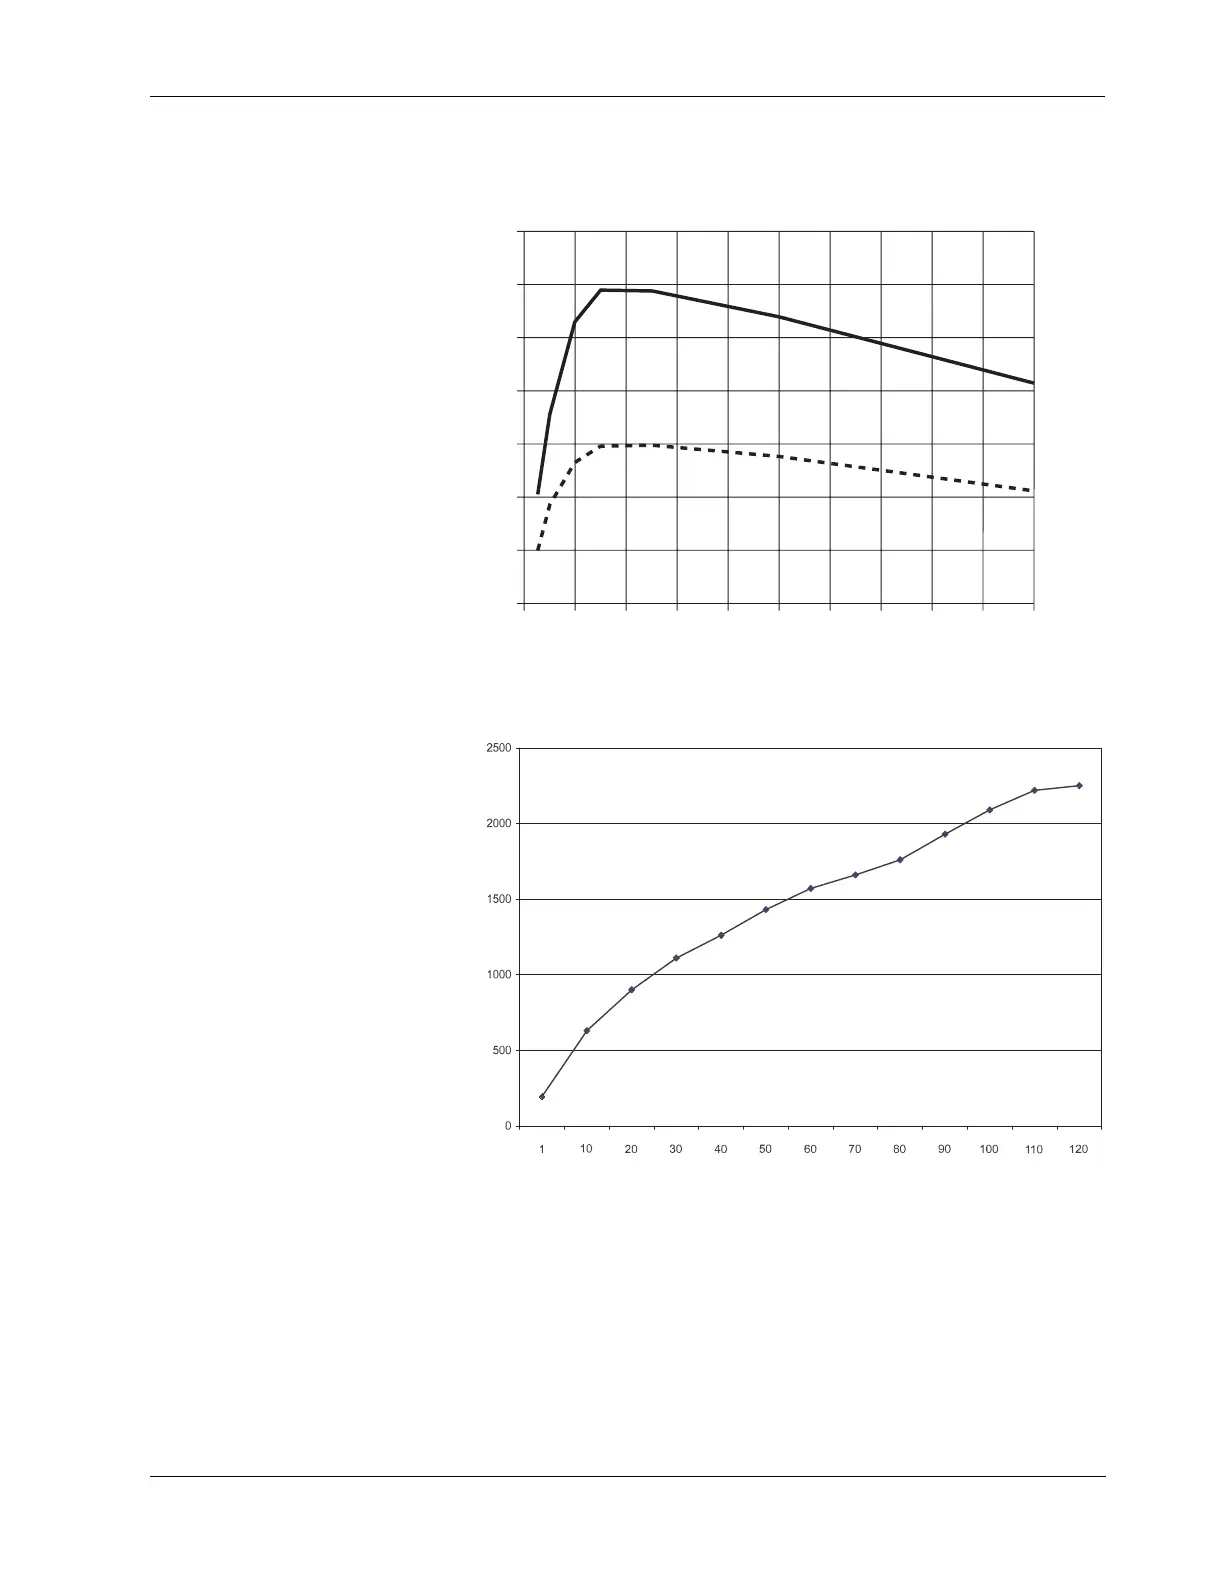
Monopolar Coag Graphs
These measurements were taken using short (< 0.5 meter) leads.
Figure 3-13.
Output power versus impedance for
Desiccate 1 coag mode
Figure 3-14.
Desiccate 1 coag mode—
output power vs. peak voltage
0 200 400 600 800 1000 1200 1400 1600 1800 2000
140
120
100
80
60
40
20
0
120 W
60 W
Load Resistance (ohms)
Output Power (watts)
Output Power (watts)
Open Circuit Peak Voltage (volts)