Quantum Receiver User Manual
Web GUI Screens
Issue No: A Page: 31
Ref: ?-Insert_Document_Part_No._Here-? Copyright © 2021 Vislink is a Vislink Technologies Inc. companies
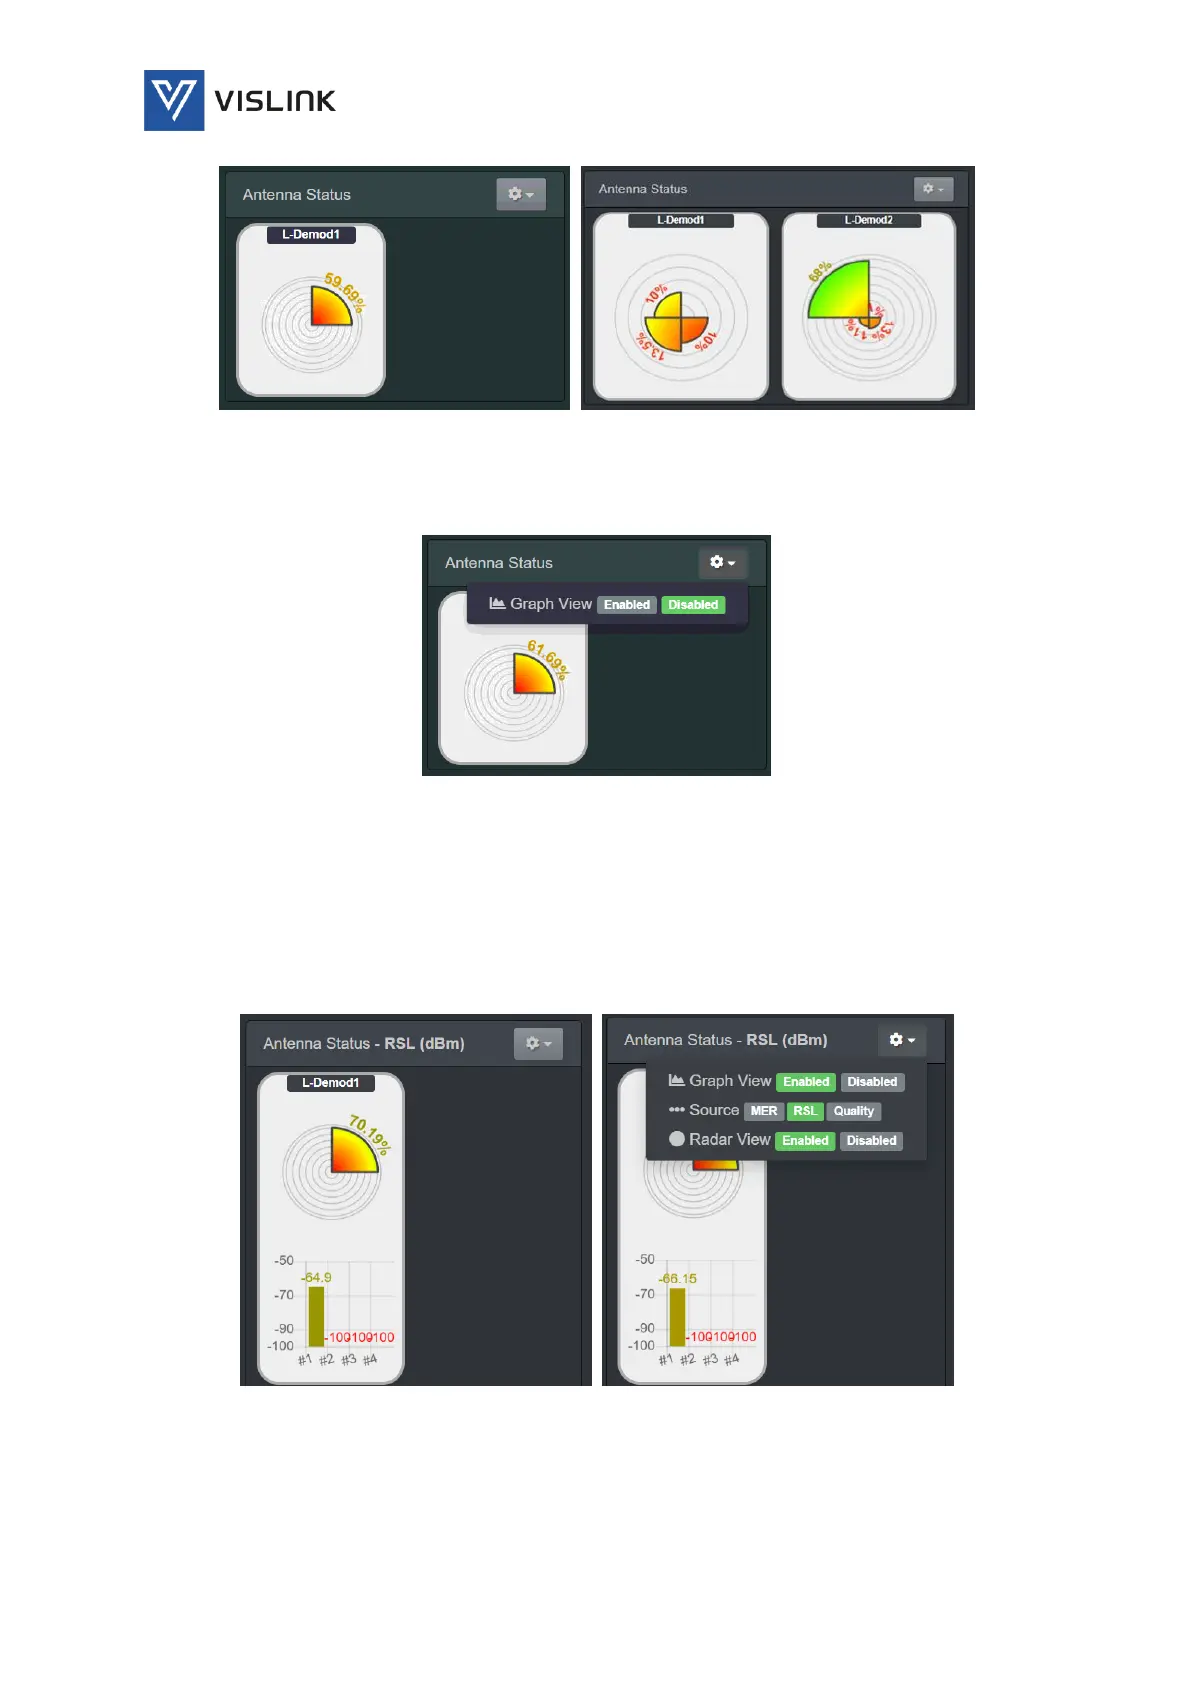
Figure 6-7 Antenna Status (Radar View)
By clicking on the options drop-down menu in the top right-hand corner of this
panel, you can select various different options for display of antenna status.
Figure 6-8 Antenna Status – Options
The Antenna Status options are:
Graph View – enables/disables a detailed graph showing either Quality (%), RSL
(dBm) or MER (dB) in the central panel for each of the four channels.
Source – enables/disables display a graph of either Quality (%), RSL (dBm) or
MER (dB) for each of the four RF channels.
Radar View – enables/disables the radar view, displaying just the graph view.
Figure 6-9 Antenna Status (Graph View)
6.2.3. Antenna Status Graphs
The Status>Antenna Status Graphs panel, displayed in the central panel,
displays either Quality (%), RSL (dBm) or MER (dB) of the signal being received