Quantum Receiver User Manual
Web GUI Screens
Issue No: A Page: 33
Ref: ?-Insert_Document_Part_No._Here-? Copyright © 2021 Vislink is a Vislink Technologies Inc. companies
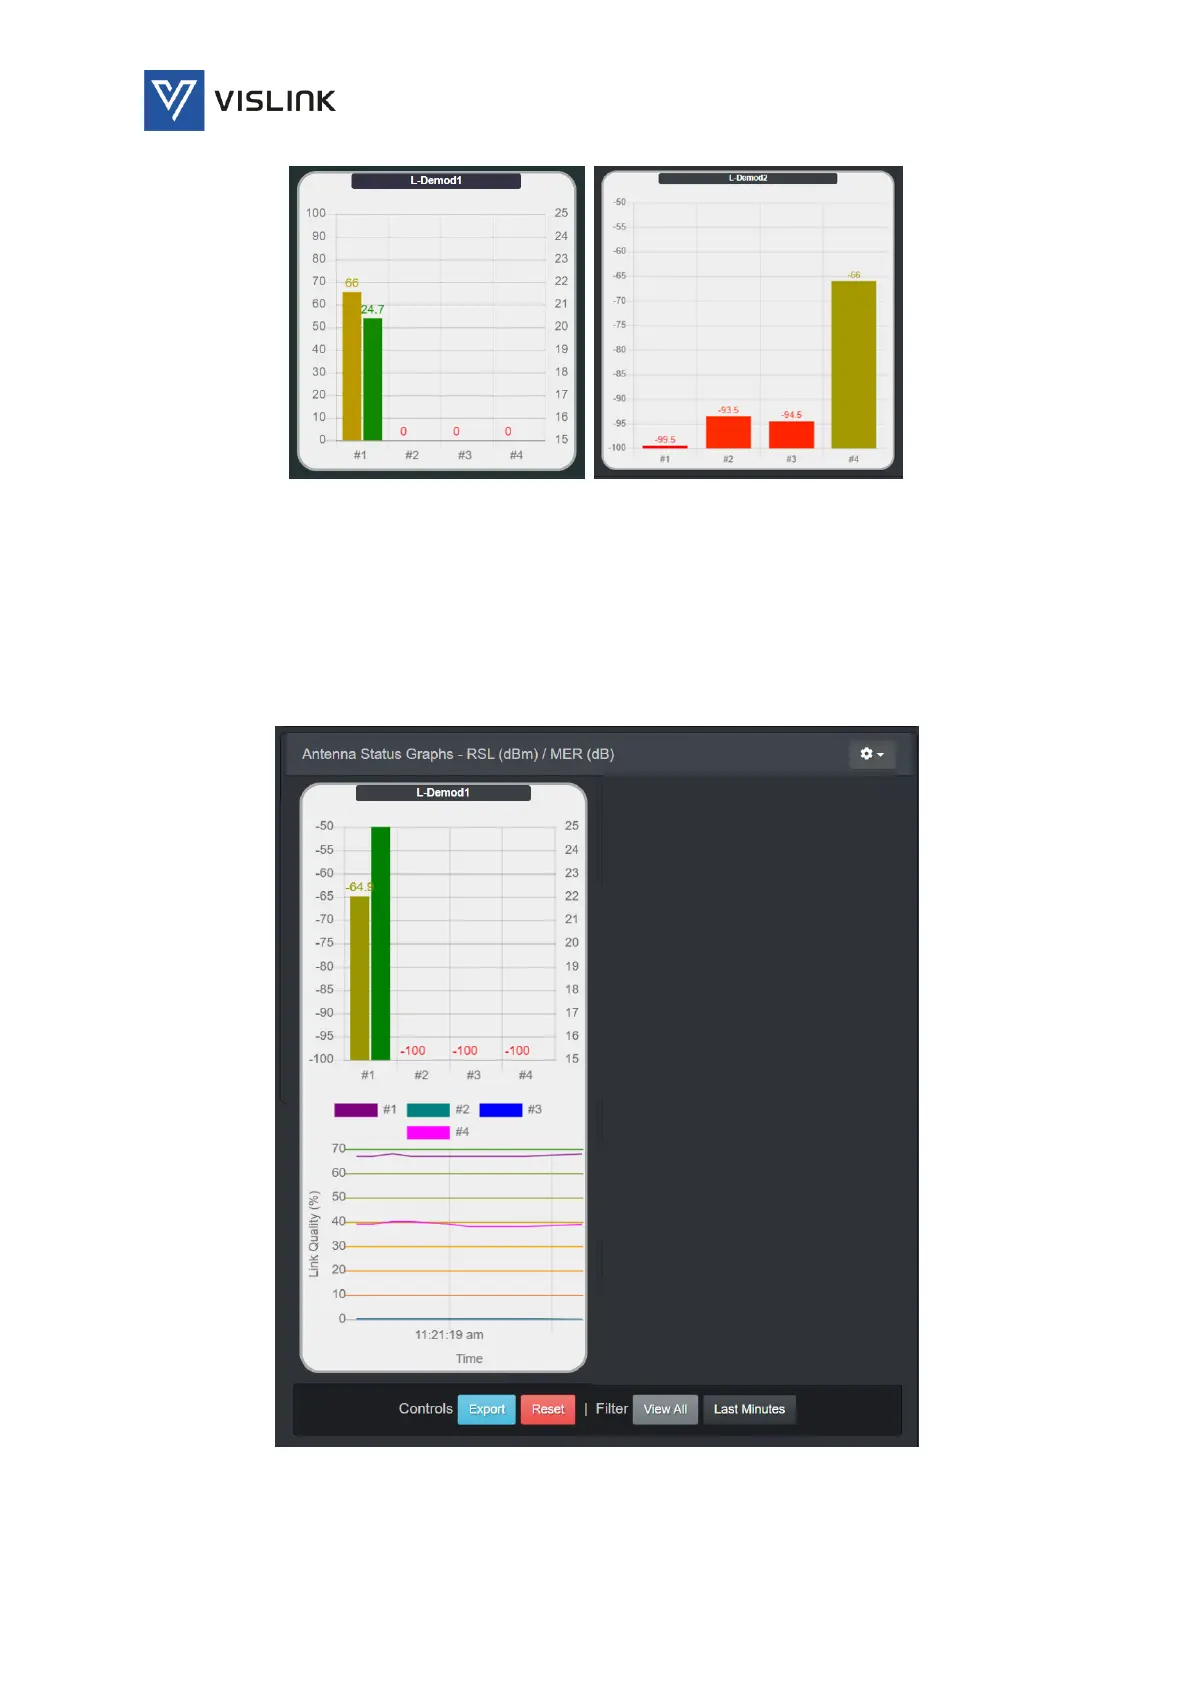
Figure 6-12 Status>Antenna Status Graphs – Quality/MER and RSL
Historical Graph – displays a historical graph of the data being measured for
monitoring/analysis over a period of time. The data displayed starts at the time
the option is selected, or when the Reset button is clicked with each channel
being shown as a different colored line. This graph may be output as a file by
clicking the Export button and selecting the storage location. The graph may be
filtered to display either just the most recent (Last Minutes) or all the data (View
All).
Figure 6-13 Status>Antenna Status Graphs – Historical Graph