Chapter 6 Monitor
ZyWALL ATP Series User’s Guide
154
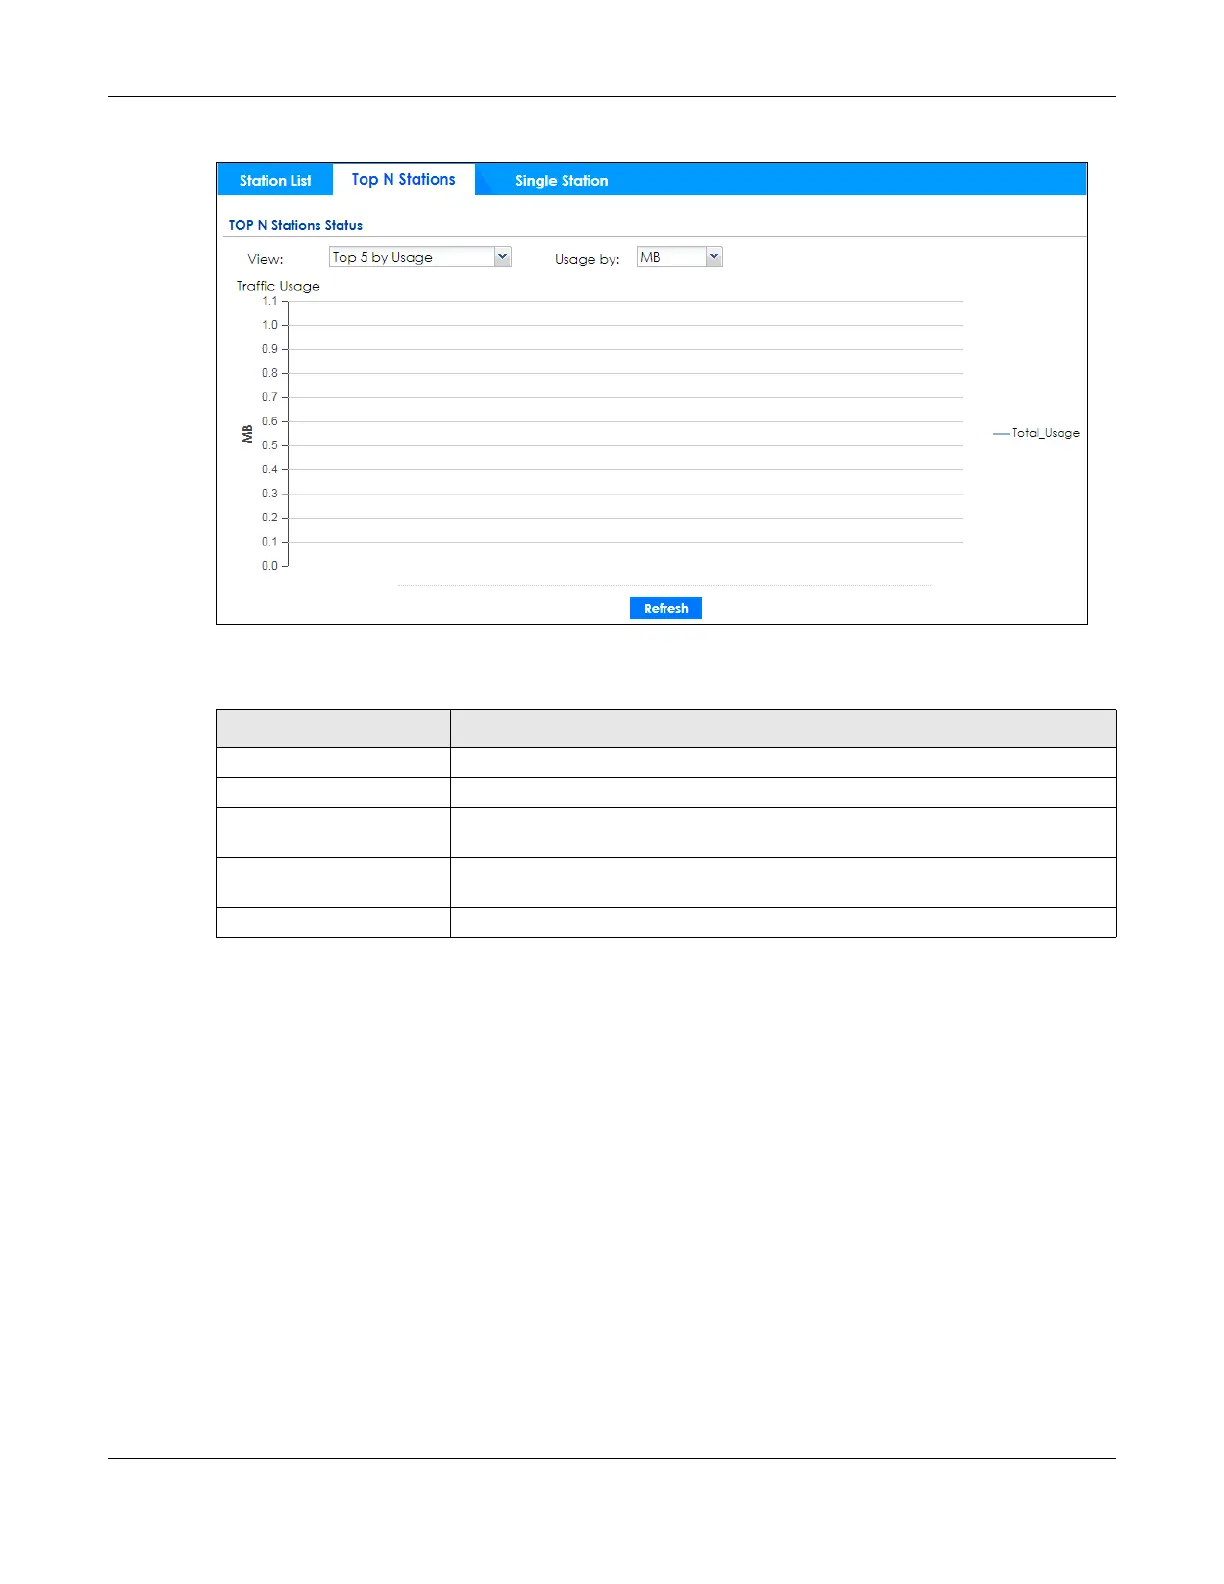
Figure 122 Monitor > Wireless > Station Info > Top N Stations
The following table describes the labels in this screen.
6.23 Station Info: Single Station
Use this screen to view traffic statistics of the wireless station you specified. Click Monitor > Wireless >
Station Info > Single Station to display this screen.
Table 53 Monitor > Wireless > Station Info > Top N Stations
LABEL DESCRIPTION
View Select this to view the top five or top ten traffic statistics of the wireless stations.
Usage by Select the measure unit in GB or MB to display the graph.
Traffic Usage This graph displays the overall traffic information about the stations for the preceding
24 hours.
y-axis This axis represents the amount of data moved across stations in megabytes per
second.
Refresh Click Refresh to update this screen.
 Loading...