46 Using the Printer
Afinia
4. ClickSubmit.
EWSNetworkSetup
TheNetworkSetuppagecanbeusedtochangetheIPinformation.Thesamesettings
canalsobechangedfromthecontrolpanel.SelecteitherContinuousorGapforthe
MediaLayout.
EWSDiagnostics
TheDiagnosticspagecanbeusedtosendtestprintstotheprinter.Thesearethesame
testprintsavailableinthecontrolpanel.
InterpretingtheGap/MarkSensorReadings
Toviewachartoftheresultsoncethe
Testrunhasbeenperformed,clickthe
GRAPHlinkontheDiagnosticspageof
theEWS(see
SensorThresholdValueson
page38).
Alternately,importthetestresult.csvfile
intoMSExcel(oranyspreadsheet)using
commaasthedelimiterfromthe
DiagnosticstabintheEWS.Columns
“a2d_refl”and“a2d_st”containthegap
(transmissive)andmark(reflective)
sensorreadingsrespectively.
Next,createalinegraphusingthe
appropriatecolumnofdata.
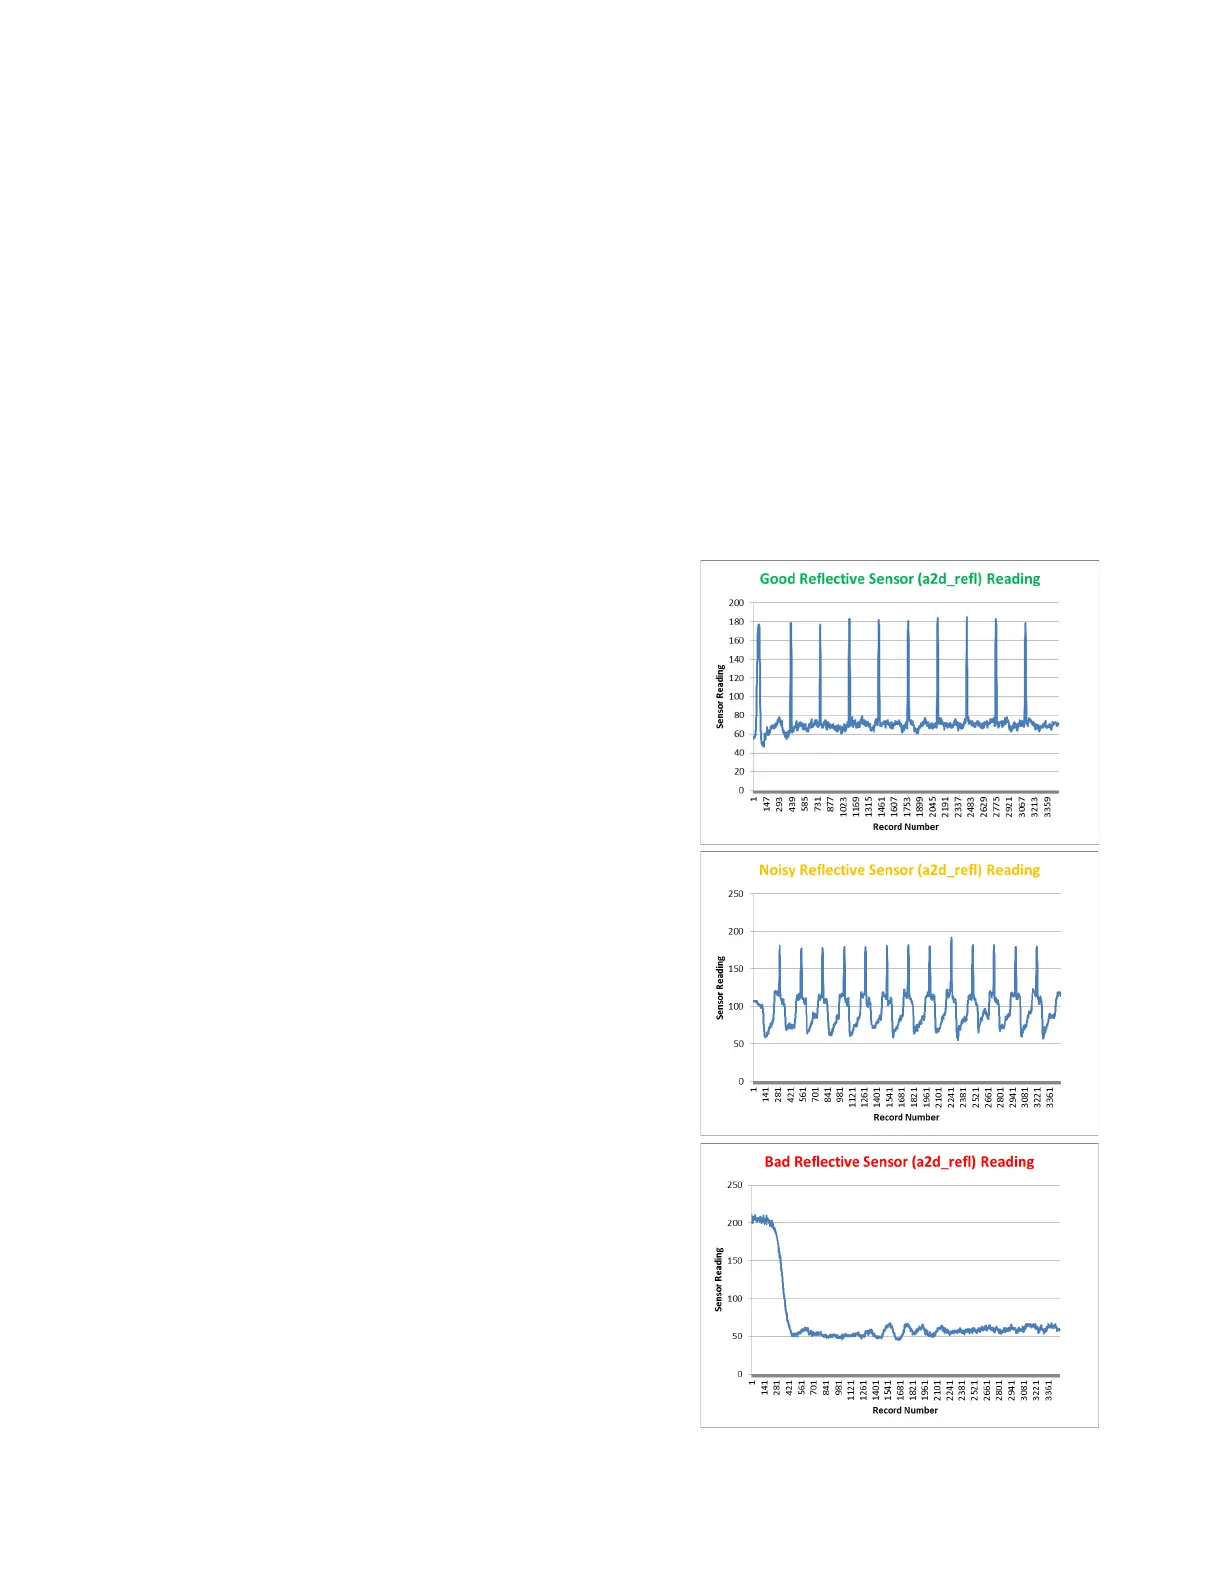
Thereare3possibletypesofplot:
1. Good‐Sharpspikesatregular
intervalsindicatingthesensorscan
clearlydetectthegapormarkonthe
media.
2. Noisy‐Imperfectspikesatregular
intervalsindicatetheprintermaybe
erroneouslydetectingthe
Top‐of‐Form.Formorereliable
detection,reducethesensitivityofthe
appropriatesensortoachievea
plot
thatisclosetoNormal.
3. Bad‐Readingsarenotdistinctive.
Increasethesensitivityofthe
appropriatesensortoachieveasclose
toaNormalplotaspossible.Ifthe
readingsdonotimprove atmaximum