60
Budge
l ,',nal yzer
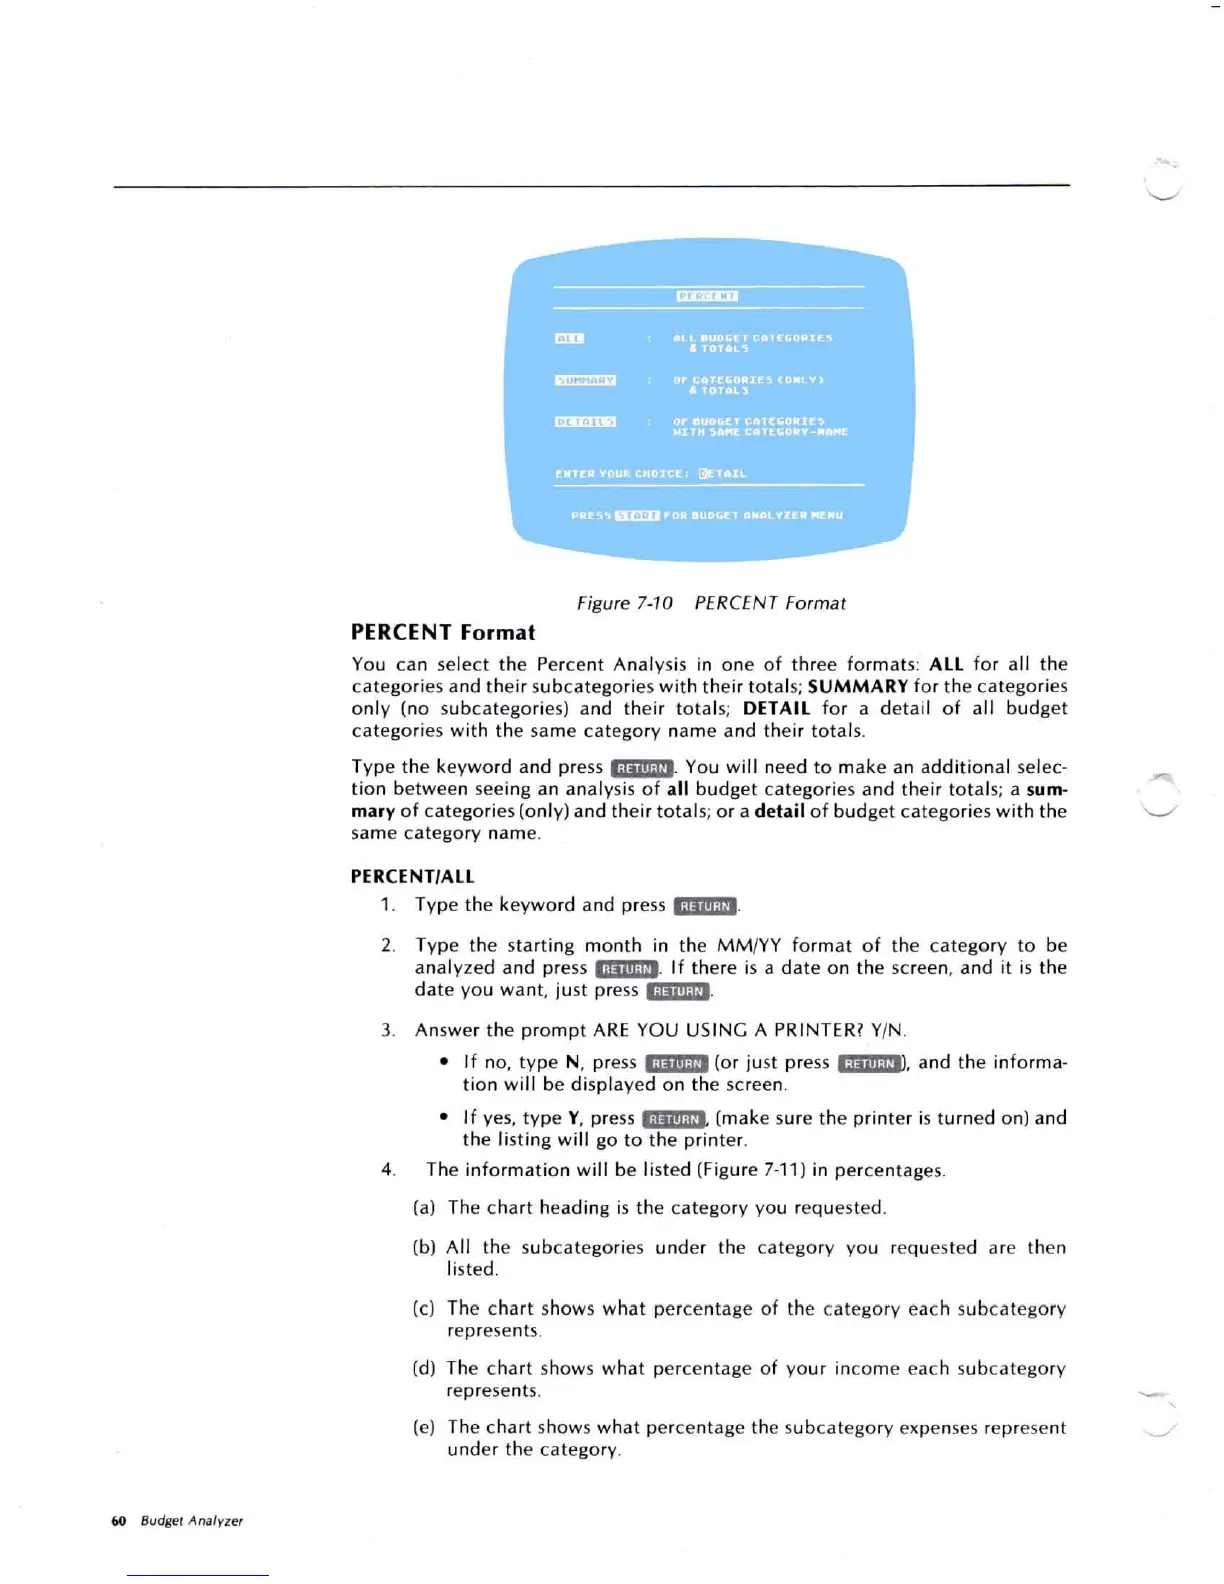
Figu re7-10 PERCEN T Fo rm at
PERCENT Format
You can selec tthe PercentAnalysis in o ne
of
t hree f
orm
ats:
ALL
fo r all t he
ca tego ries and thei r subc ate gories w it h t heir to ta ls; SUMMARY for thecategories
on
ly
(no subc ate go ries) andth
eir
t
ot
al s;
DETAIL
for a det ail o f all budget
cate gories wit h t hesame cate go rynam e and their t
ot
als.
Type the keywo rd and press
';Ii'li-Vi
. You w ill need to make an additi onal selec-
ti on bet w een seeingan analysis o f
all
bud
get cate go ries and th eir t
ot
als; a sum-
mar
y o f
cate
go ries (o nly ) and th ei r to t als; o r a detail o f
bud
get cate go ries
with
th e
same category name.
PERCENT/ALL
1. Type the keywo rd and press ij!iiii;Vi.
2. Typ e thestarting mont h in t he M M /YY fo r
mat
of
th e cat egory to be
analyzed and p ress
';iiliii;V'.
If there is a date onthe screen, and it is the
date youwant. just press
"'i,wWH,
3. A nswer the p
romp
tA
RE
YOU USING A PRINTER? YIN .
•If no, type N, press liiiiii@i (or just press ';iiiiimil, and the informa-
t ion w ill be d isplayed o nthe screen.
•If yes, type V, press
';iiiil
·V'
(makesure the printer is turned on)and
t he li stin gwill go to t he p rin ter.
4. The inf
orm
ation
wil
l be li st ed (Figure7-11 ) in per c
ent
ages.
(a) Thechart he
adin
g is thecatego ry youreq uested.
(b)All t hesubc atego ries und erthe ca tego ry yo ure qu ested are then
l isted.
(c) Thechart show s w hat perce ntage of the catego ry eac h subc atego ry
represen ts,
(d) Thechart shows w hat percent age of yo ur incom e eac h subcatego ry
r
epr
esent s.
(e)Thecha rt shows w hatpe rcen tage t hesubca teg o ry expenses represent
und er th e ca tego ry.