62 Budge!
....
nalyzer
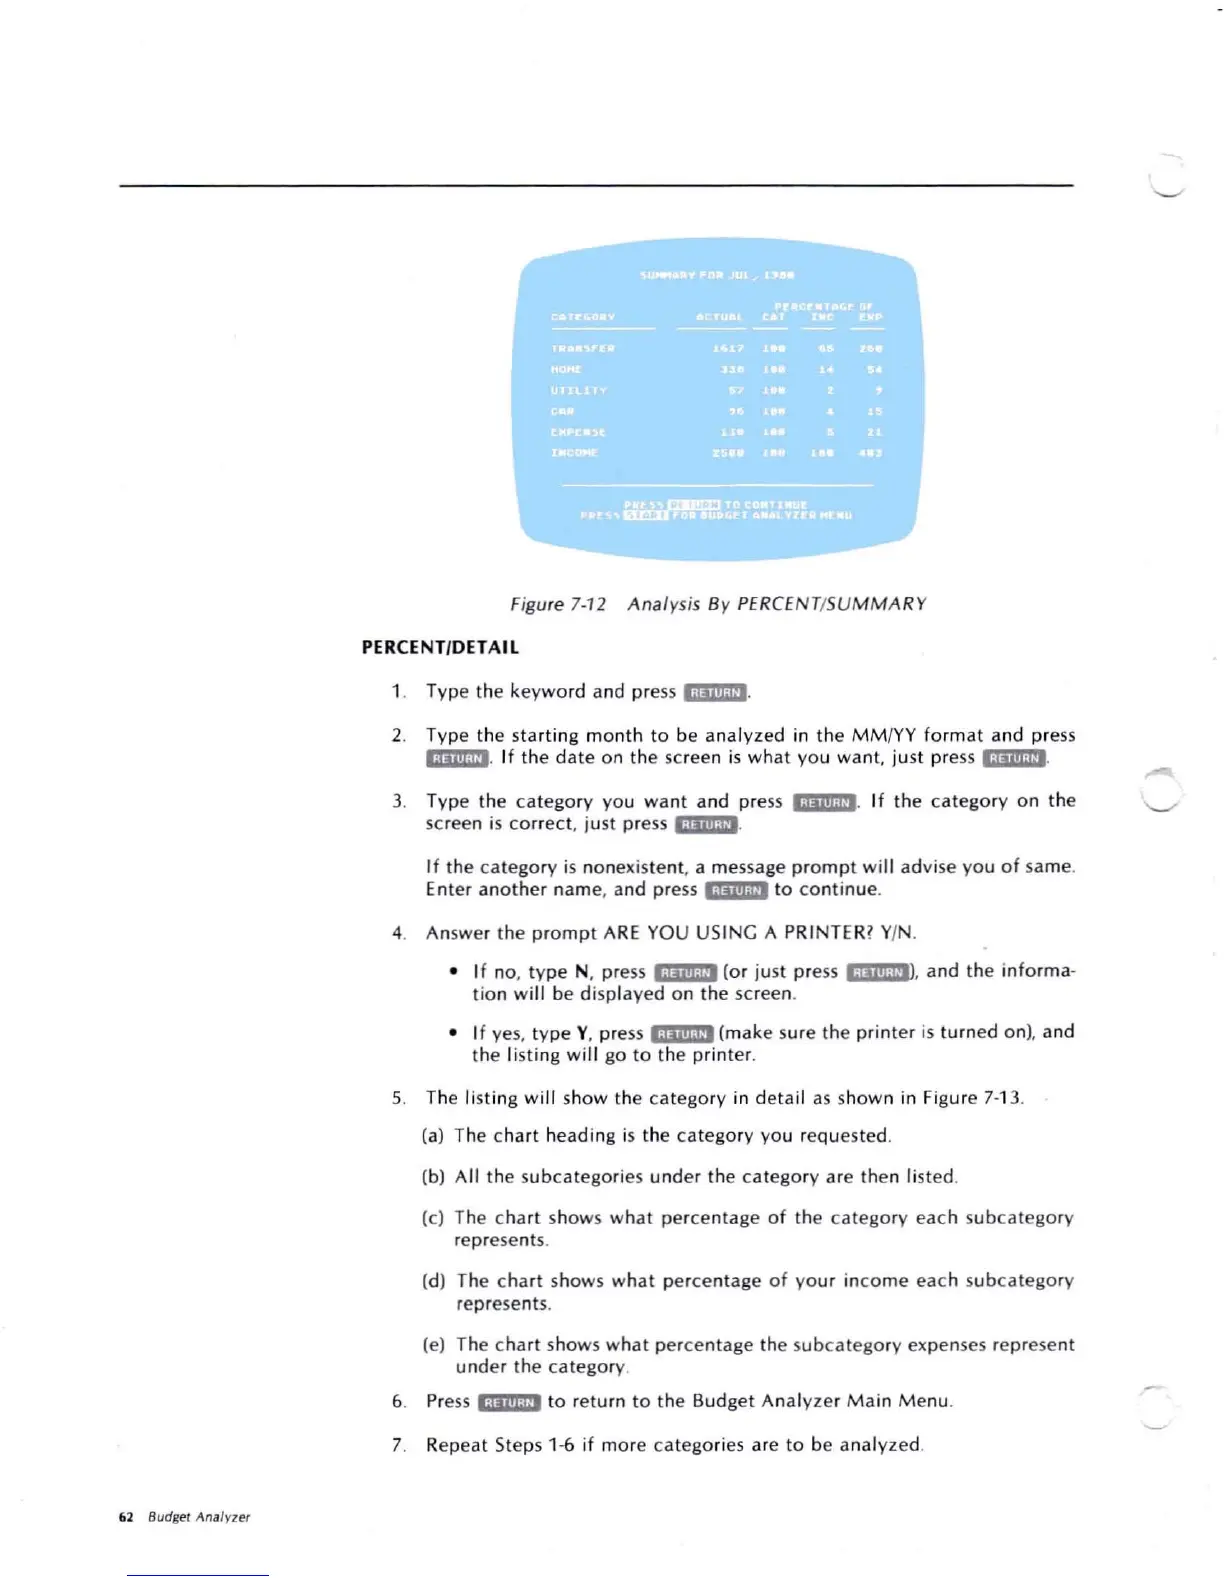
Figure 7-12 Analys is By
PER
CE
NT/SUMM AR Y
PERCENT/DETAIL
1 . Typ e the keyw o rd a nd press
i;iiiiii;iJi.
2. Typ e t hesta rt ing m
onth
to be analyz ed in t he MM/YY fo r
mat
and p ress
@;Ii"'·,?i.
I f the dat eonthe screen is wh at yo u wa nt . justpress '
.Iiili-Mi
.
3. Type thecatego ry you want and p ress ij'ji"iPi. If the catego ry on the
scree n is correct, just pr ess
'
.lil"'Vi
.
If th e ca te go ry is non exist
ent
, a messa ge
promp
t w ill advise you o f same .
Enter ano the r nam e, and press
"'jiii;!?'
to co ntinue .
4. A nswe r the pr
omp
tARE YOU USING A PRINTER? YIN.
• If no, ty pe N , press
';iiiiii;V'
(o r just p ress l iiJiii;i:lJ, and the info rma -
tio
n w
ill
be d isplayed o n th e screen.
• I f yes,
typ
e Y. press
liijlihi'
(ma ke sure the print er is tu rned on), and
the l ist i ng
wil
l go to t he print er.
5. The list ing wi ll show the ca t egory in
det
ail as show n in Figu re 7-13.
(a) The chart heading is t hecategory yo urequ ested.
(b) A ll th esubca tego ries u nder the ca tego ry ar e then li sted.
(c) The cha rt shows w hat pe rce ntage
of
the category eac h
subcat
ego ry
rep resents.
(d) Thechart shows wha t percen tage
of
you
r i nco me each subc atego ry
represe nts.
(e) Thechartsho ws wh at percen t age t he sub
catego
ry expenses rep rese nt
unde r the catego ry .
6. Press i ;i#lIi;Vi to return to the BudgetAnalyzer M ain M enu.
7. Re peat Steps 1-6 if mor e ca tego ries are to beana
lyze
d.