PN 177196BB
7-30
DATA MANAGEMENT AND REVIEW
DATA ANALYSIS REVIEW - PLATELET PARAMETERS
b. In this example, S1 and S2 are placed so that:
1) 15% of the platelets occur between 2 fL and S1.
2) 15% of the platelets occur between S2 and the variable upper threshold.
Note: This threshold is explained under the Detecting Abnormal Platelet
Distributions that follows.
2. PDW result is determined on the platelets between S1 and S2.
3. PDW parameter result is displayed and printed as a percentage (%).
4. PDW is not an FDA approved parameter; therefore, this parameter label and result are
not routinely displayed in the United States, but may be routinely displayed in other
countries.
Detecting Abnormal Platelet Distributions
1. The Analyzer evaluates each platelet distribution.
a. When platelet histogram is being evaluated, a mobile threshold can move from its
starting position at 25 fL to 18 fL.
b. The computer searches for a valley between the platelet and red cell populations.
c. If no valley is detected between 18 fL and 25 fL, the threshold remains at 25 fL and
no flag is generated.
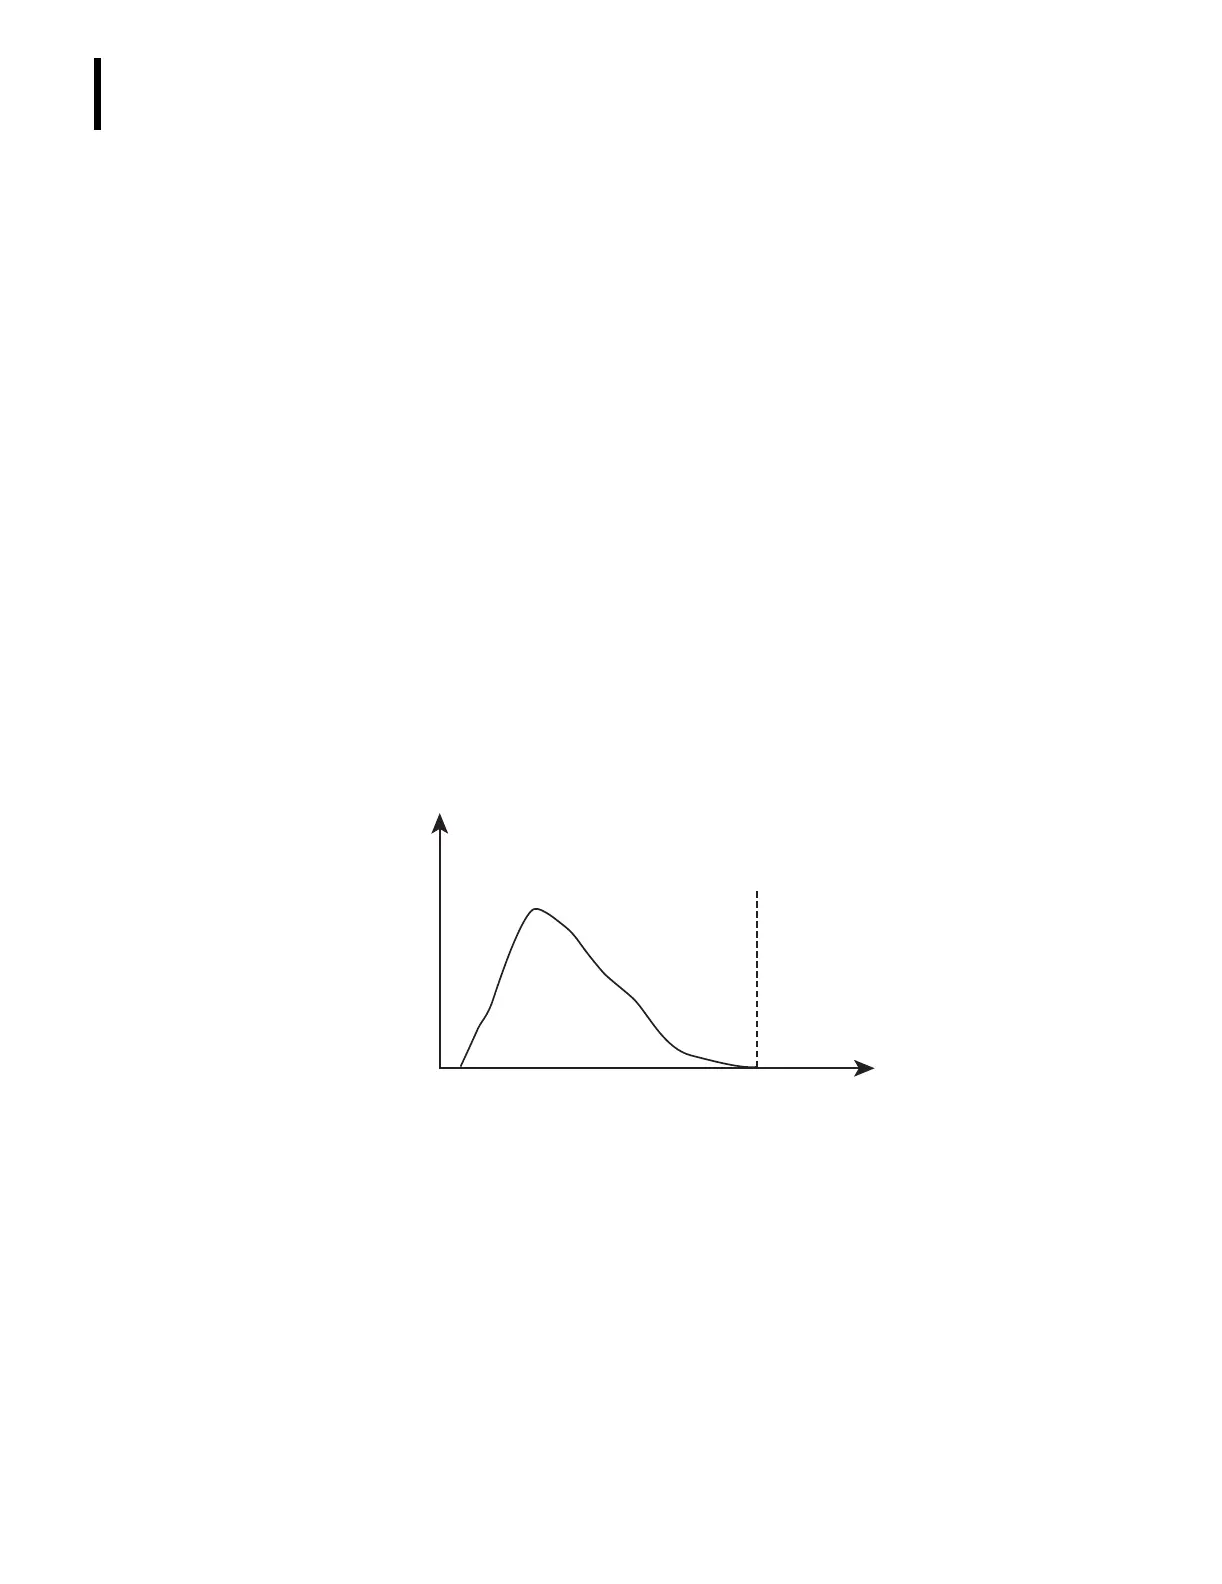
d. In the typical platelet distribution that follows, no valley is detected between 18 fL
and 25 fL, the threshold remains at 25 fL and no flag is generated.
2. Particles of approximately platelet size can interfere with platelet histogram and count.
a. Small particles, such as microbubbles or dust, can overlap the low end of the
histogram.
1) If the number of pulses in the 2 to 3 fL region is higher than the predefined
limits:
a)
An SCL flag appears next to any Plt count >5.0 x 10³/µL to alert the
Operator that a significant number of small cells or interference, such as
microbubbles, are present.
Note: If Plt <5.0 x 10³/µL, the
SCL flag is not reported.
b) MPV, Pct, and PDW are reported as
. . . ..
c) In this scenario, rerun the specimen and verify the results.
2) In the Plt distribution that follows, small cells are present in the 2 fL and 3 fL
regions.
3
25µ
30
 Loading...


