Rev. 3.1 5.ECG 116
BM5 (CS,CX) User’s Manual
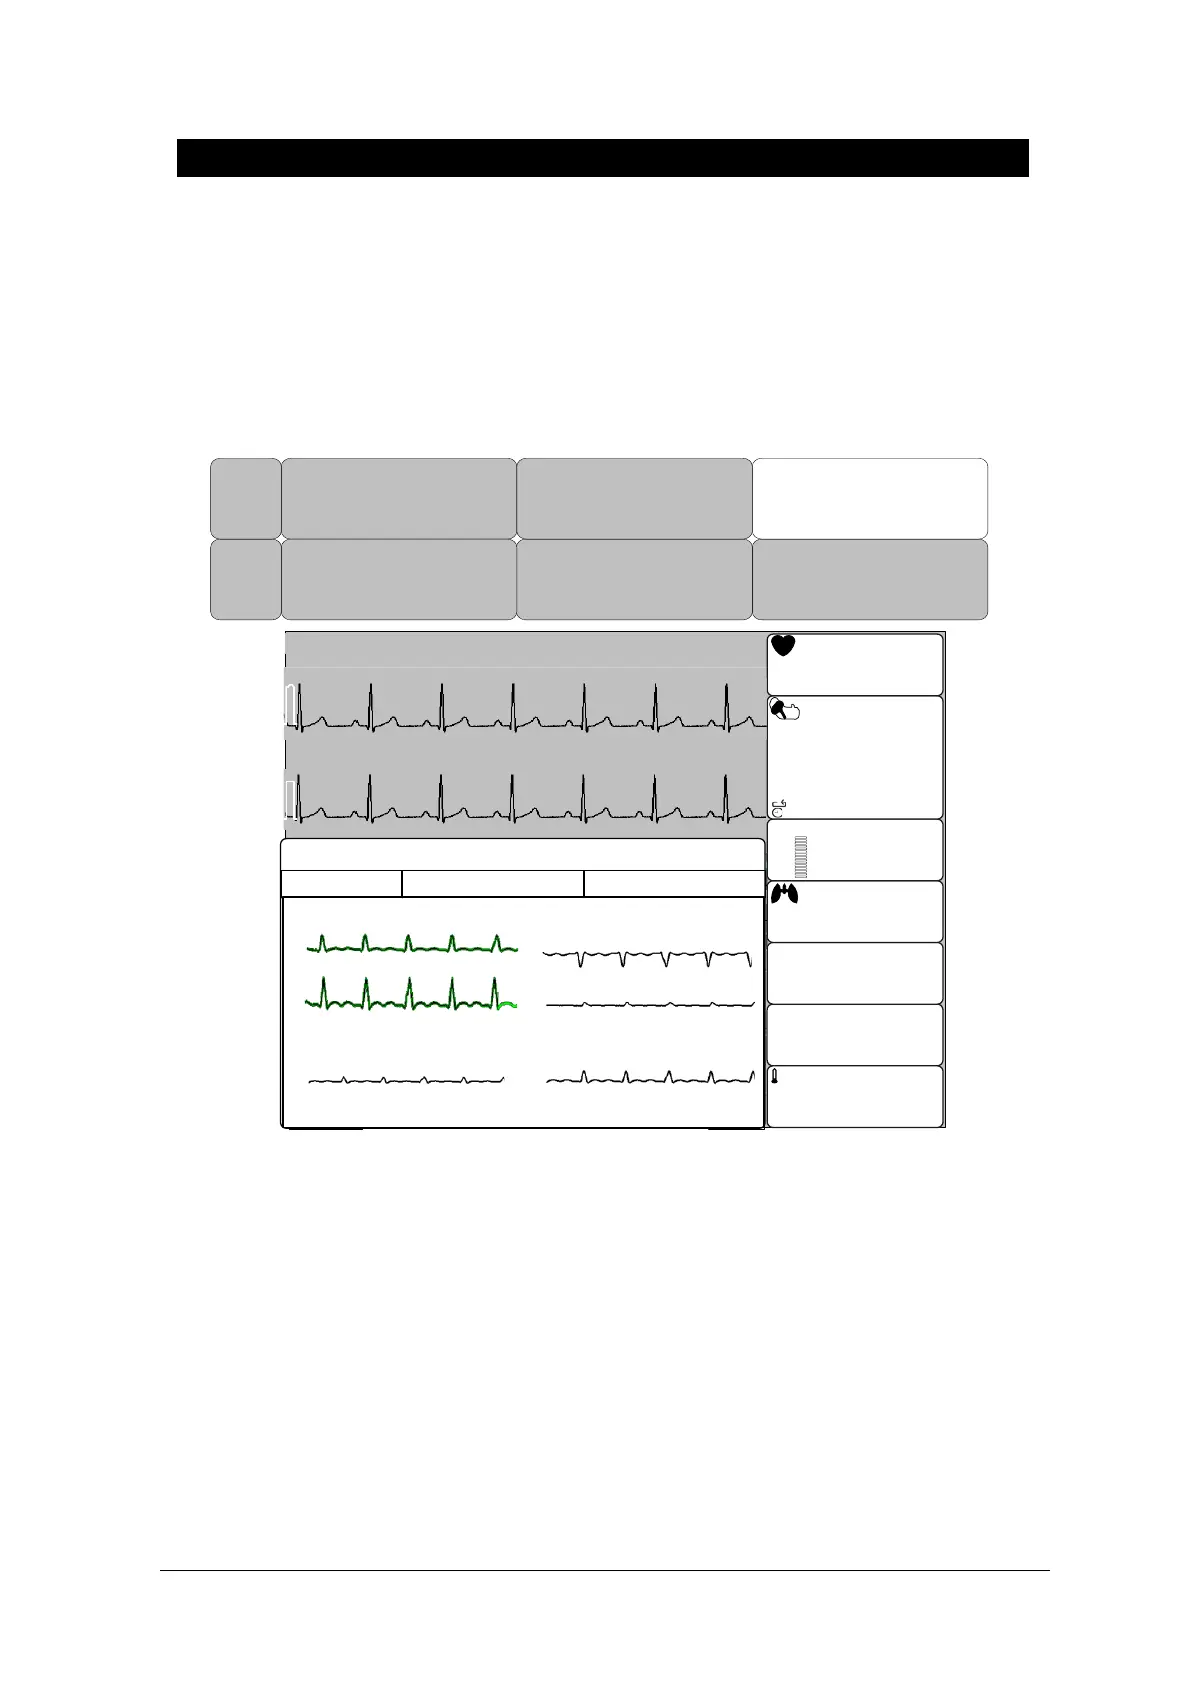
ANALYSIS WAVE
Showing interpreted ECG wave for 2.5 seconds period of each 3 channels in total 10
seconds from starting Interpretation. For example, each channel shows each time period as
CH I, II, III show for 0~2.5 second section, CH aVR, aVL, aVF show in 2.5~5 second section,
CH V1, V2, V3 show in 5~7.5 second section and CH V4, V5, V6 show in 7.5~ 10 second
section. Under this window, all the ECG channels are printed out
PREV
MENU
MAIN
MENU
ANALYSIS
REPORT
AVERAGE
WAVE
ANALYSIS
WAVE
10-MAY-09 12:23
JOHN
II
SpO2
RR II X1
BED-001
(93)
120
80
120
℃
200
80
11
CVP
80
(94)
/
80
200
09:30
1HR
ADT
02:10
S
%SpO2
90
100
100
50
150
RPM
20S
30
20
mmHg
P
BPM
80
CVP
ART
160
30
ART
3
15
FREEZE
0
10
80
II
0.0
ST(mm)
PVC (/min)--
S
ICU110
T1
T2
36.7
36.7
RR II
x2
M
ST(mm)--.-
III
II X1
PR
80
mmHg
42.0
30.0
30.0
42.0
ART
RETURN NEXT PAGE >> 2008/04/23 22:12:20
I
II
III
aVR
aVL
aVF
ANALYSIS WAVE