150
9 - 2 Analyzing a Function Graph
• If there is more than one
x-coordinate value for a given y-coordinate value or
more than one
y-coordinate value for a given x-coordinate value, use e and
d to move between them.
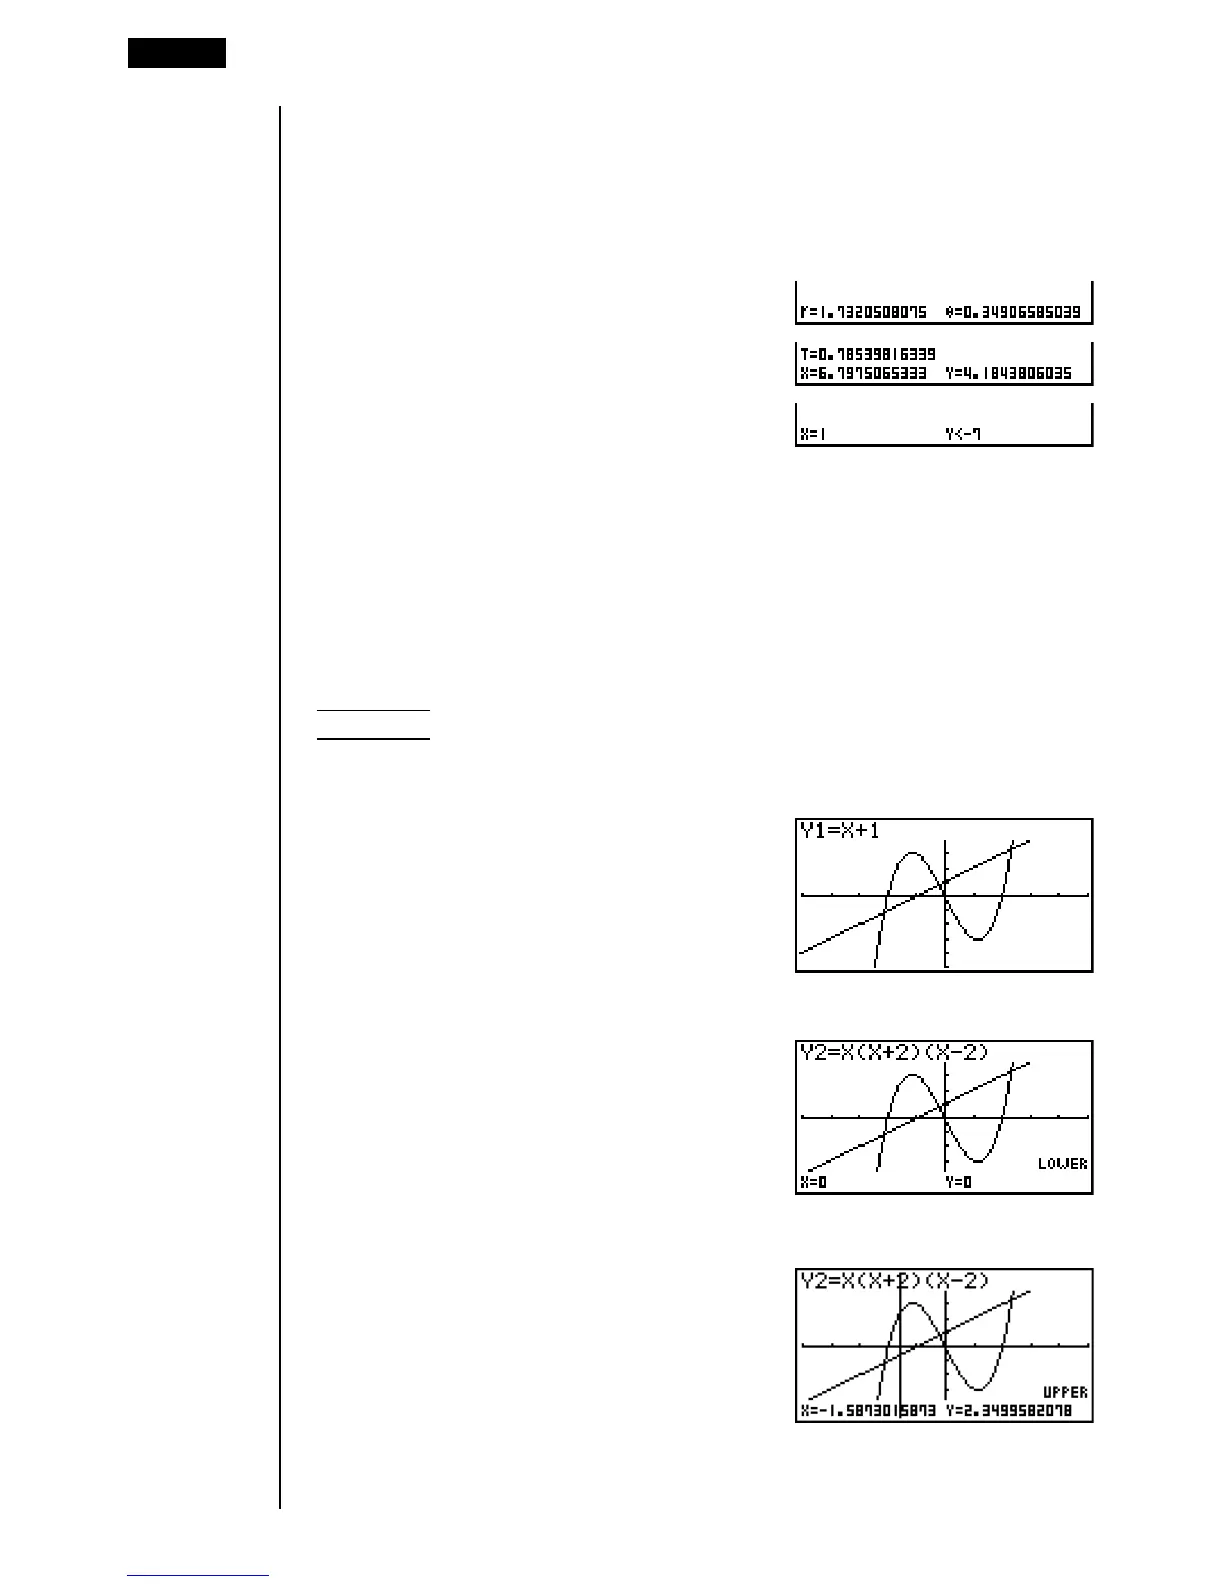
• The display used for the coordinate values depends on the graph type as
shown below.
• Polar Coordinate Graph
• Parametric Graph
• Inequality Graph
• Note that you can not determine a y-coordinate for a given x-coordinate with a
parametric graph.
• If there is only one graph, pressing 1 (Y-CAL) / 2 (X-CAL) directly displays
the x-coordinate/y-coordinate (selection of the graph is not required).
kk
kk
k Determining the Integral for Any Range
Example
∫
–1.5
0
x (x + 2) (x – 2) dx
View Window: (A)
!5(G-Solv)6(g)
3(∫dx)
(Graph selection standby)
Select graph.
cw
•The display is prompting input of the lower limit
of the integration range.
Move the pointer and input the lower limit.
d~dw