224
uu
uu
uTo specify the color of the graph ({BLUE}/{ORNG}/{GRN})
The default color for a graph is blue. Use the following procedure to change the
graph color to orange or green.
1. Display the Recursion Menu and then use f and c to highlight the formula
whose graph color you want to change.
2. Press 1 (SEL+C).
3. Press the function key that corresponds to the color you want to specify.
uu
uu
uTo specify the draw/non-draw status of a formula ({SEL})
There are two options for the draw/non-draw status of a recursion formula graph.
•Draw the graph for the selected recursion formula only
•Overlay the graphs for both recursion formulas
To specify the draw/non-draw status, use same procedure as that for specifying
generation/non-generation status.
uu
uu
uTo specify the type of data to be plotted (Σ Display: On)
You can specify one of two types of data for plotting.
• an on the vertical axis, n on the horizontal axis
• Σan on the vertical axis, n on the horizontal axis
In the function menu that appears while a table is on the display, press 5
(G·CON) or 6 (G·PLT) to display the plot data menu.
•{an}/{Σan} ... {an}/{Σan} on vertical axis, n on horizontal axis
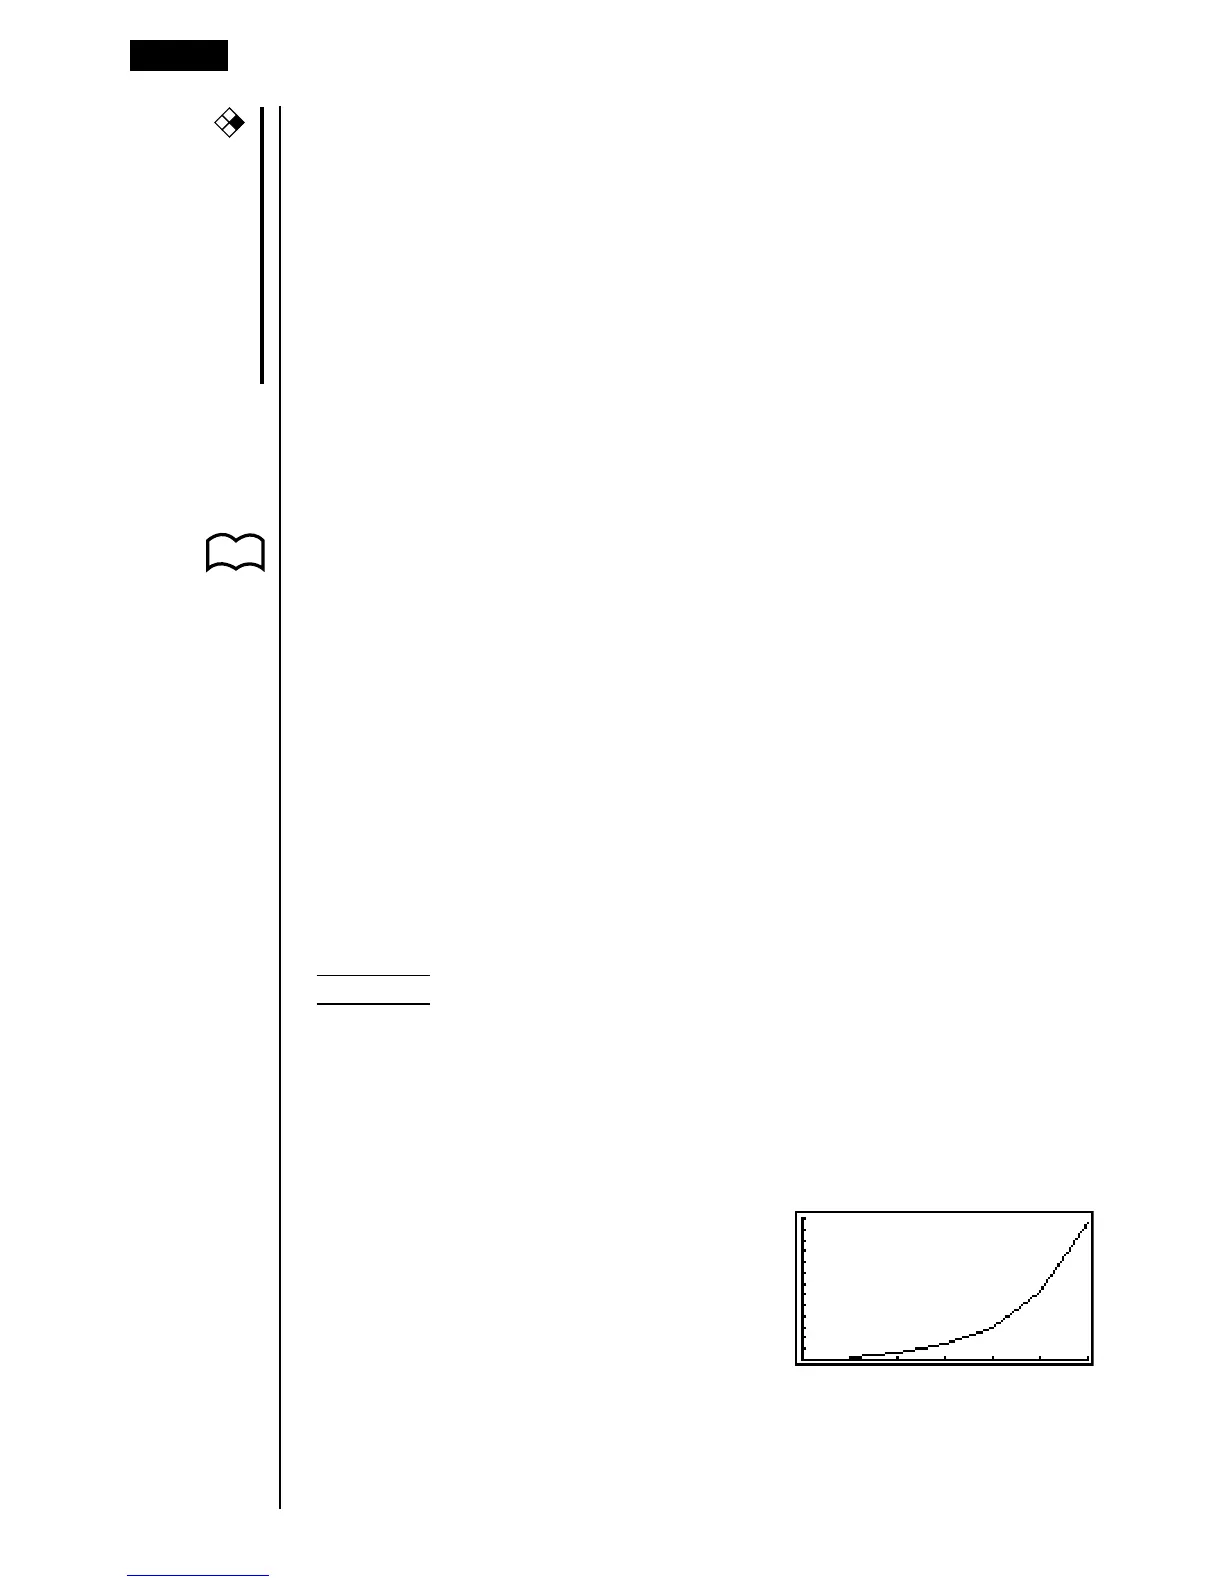
Example 1 Draw a graph of an+1 = 2an + 1 with an on the vertical axis and n
on the horizontal axis, and with the points connected.
Set the following parameters in the View Window.
Xmin = 0 Ymin = 0
Xmax = 6 Ymax = 65
Xscale = 1 Yscale = 5
6(TABL)5(G·CON)
(Selects connected type.)
1(an)
(Draws graph with an on the vertical
axis.)
16 - 3 Editing Tables and Drawing Graphs
P. 222
CFX