225
Editing Tables and Drawing Graphs 16 - 3
Example 2 Draw a graph of an+1 = 2an + 1 with Σan on the vertical axis and n
on the horizontal axis, and with the points unconnected.
Use the same View Window parameters as those provided in
Example 1.
6(TABL)6(G·PLT)
(Selects plot type.)
6(Σan)
(Draws graph with Σan on the vertical
axis.)
•To input a different recursion formula after a graph is drawn, press ! Q.
This displays the Recursion Menu where you can input a new formula.
kk
kk
k Drawing a Convergence/Divergence Graph (WEB graph)
With this feature, you can draw a graph of an+1 = f
(an) where an+1 and an are the
terms of linear recursion between two terms, substituted respectively for y and x in
the function y = f
(x). The resulting graph can then be viewed to determine whether
or not the graph is convergent or divergent.
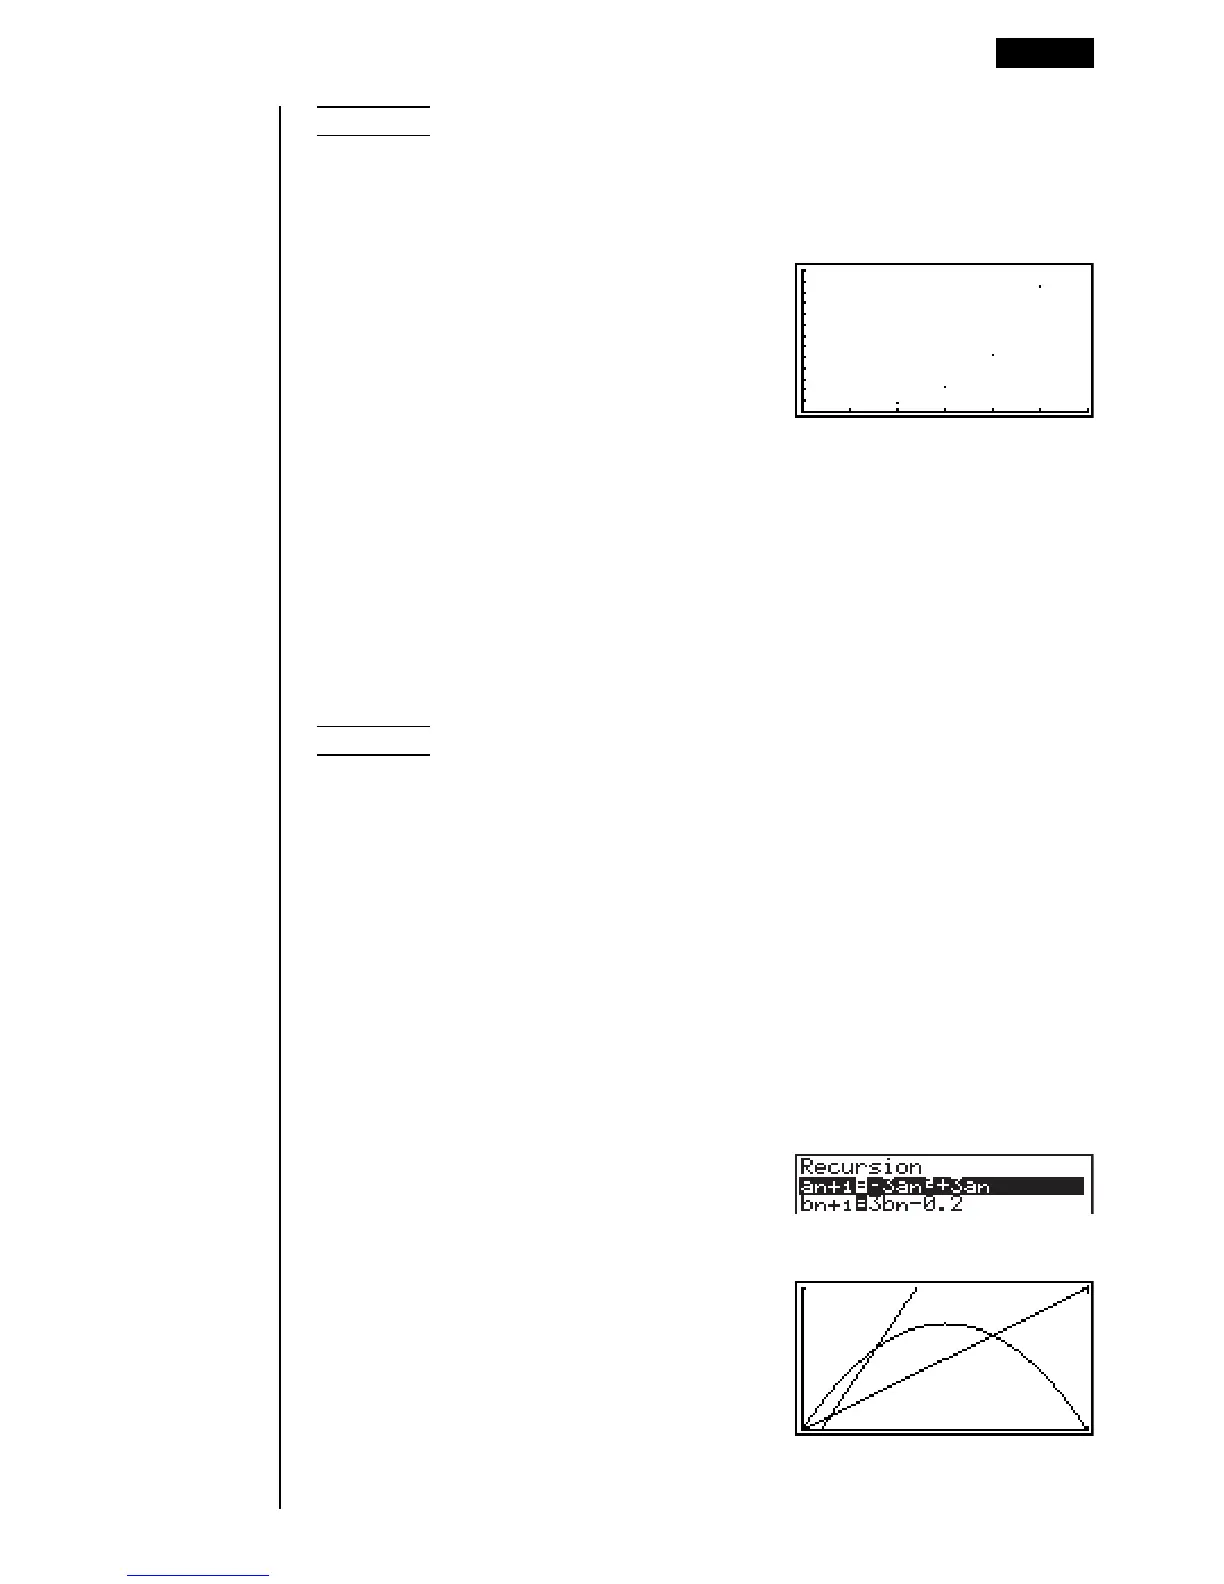
Example 1 To determine whether or not the recursion formula an+1 = –3an
2
+ 3an is convergent or divergent.
Use the following table range.
Start = 0 End = 6
a0 = 0.01 an Str = 0.01
b0 = 0.11 bn Str = 0.11
Use the following View Window parameters.
Xmin = 0 Ymin = 0
Xmax = 1 Ymax = 1
Xscale = 1 Yscale = 1
This example assumes that the following two recursion formulas are already
stored in memory.
1. Press 6(TABL) 4(WEB) to draw the graph.