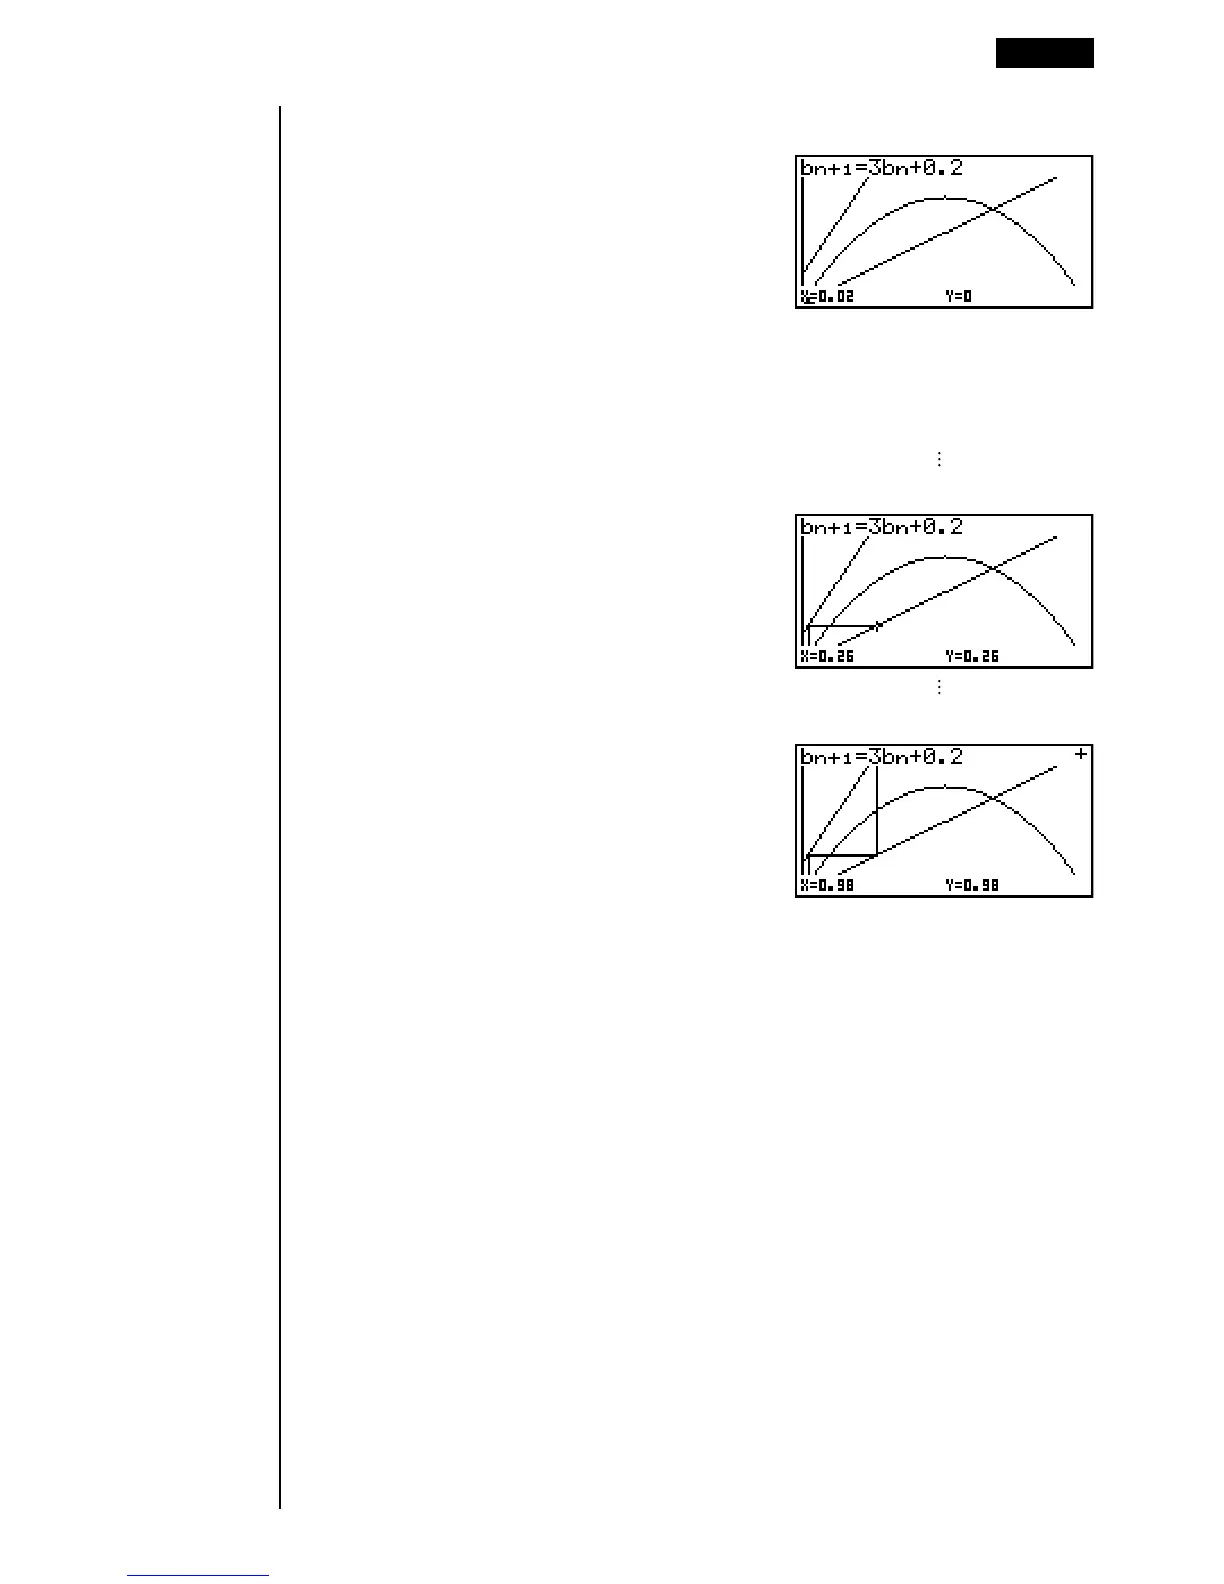
Do you have a question about the Casio fx-9750G PLUS and is the answer not in the manual?
Model | fx-9750G PLUS |
---|---|
Category | Graphing Calculator |
Display | LCD |
Screen Size | 128 x 64 pixels |
Power Source | 4 x AAA batteries |
Programming | Yes |
Graphing Functions | Yes |
Statistical Functions | Yes |
Equation Solver | Yes |
Connectivity | No |
RAM | 28 KB |
Describes how to enter GRAPH Mode from the Main Menu.
Explains icons, menu titles, and command list usage within the guide.
Explains the color coding for orange and red key markings on the calculator.
Describes how to select an icon from the Main Menu to enter a mode.
Explains how to access and change mode settings via the set up screen.
Describes the text and graphic display capabilities of the calculator.
Explains the available display colors for graphs and text.
Explains how to adjust display darkness/lightness using cursor keys.
Steps to reset calculator modes and settings to original state.
Explains the low battery message and its implications for operation.
Setting angle unit and display format before initial calculations.
Explains variable storage, function memory, and memory status.
Performing arithmetic operations, including negative values and priority.
Accessing and using hyperbolic, probability, numeric, angle, and engineering notation functions.
Describes items for Solve, differential, integration, max/min, and Sigma calculations.
Explains how to perform differential calculations using the function analysis menu.
Covers arithmetic operations and reciprocal/root/square calculations.
How to specify default or input number systems.
Entering Matrix Mode, memory, and creating matrices.
Row and column operations like swap, multiply, add, delete.
Entering Equation Mode and clearing equation memories.
Specifying ranges and spacing for axes, initializing settings.
Storing, editing, and specifying graph types (Rectangular, Polar, Parametric).
Accessing the function menu for graph analysis.
Determining roots, max/min values, y-intercepts, intersections, integrals.
Drawing tangent lines, normals, inverse functions, and plotting points.
How to set different view window parameters for active and inactive screens.
Storing pointer coordinates in a table and saving table data to list files.
General procedure for drawing dynamic graphs, setting conditions, and speed.
Examples of graphing circles and hyperbolas.
Storing functions and generating tables using range or list.
Inputting formulas and generating tables using range or list.
Inputting values into lists and manipulating list data.
Entering STAT Mode and understanding statistical data lists and menus.
Inputting data, plotting scatter diagrams, changing graph parameters.
Drawing Histograms, Med-Box, Mean-Box, Normal Distribution, Broken Line graphs.
Overview of financial calculations and graphing in Financial Mode.
Formulas and input screens for simple interest calculations.
Introduction to programming, file names, and program list.
Examples of creating, inputting, and running programs.
Procedure for connecting two units using an SB-62 cable.
Procedures for sending and receiving data, including selected items and backup.
Program to produce prime factors of positive integers.
Program to determine the greatest common measure using Euclidean division.