228
16 - 3 Editing Tables and Drawing Graphs
kk
kk
k Drawing a Recursion Formula Graph Using Dual Screen
Selecting “T+G” for the Dual Screen item of the set up screen makes it possible to
display both the graph and its numerical table of values.
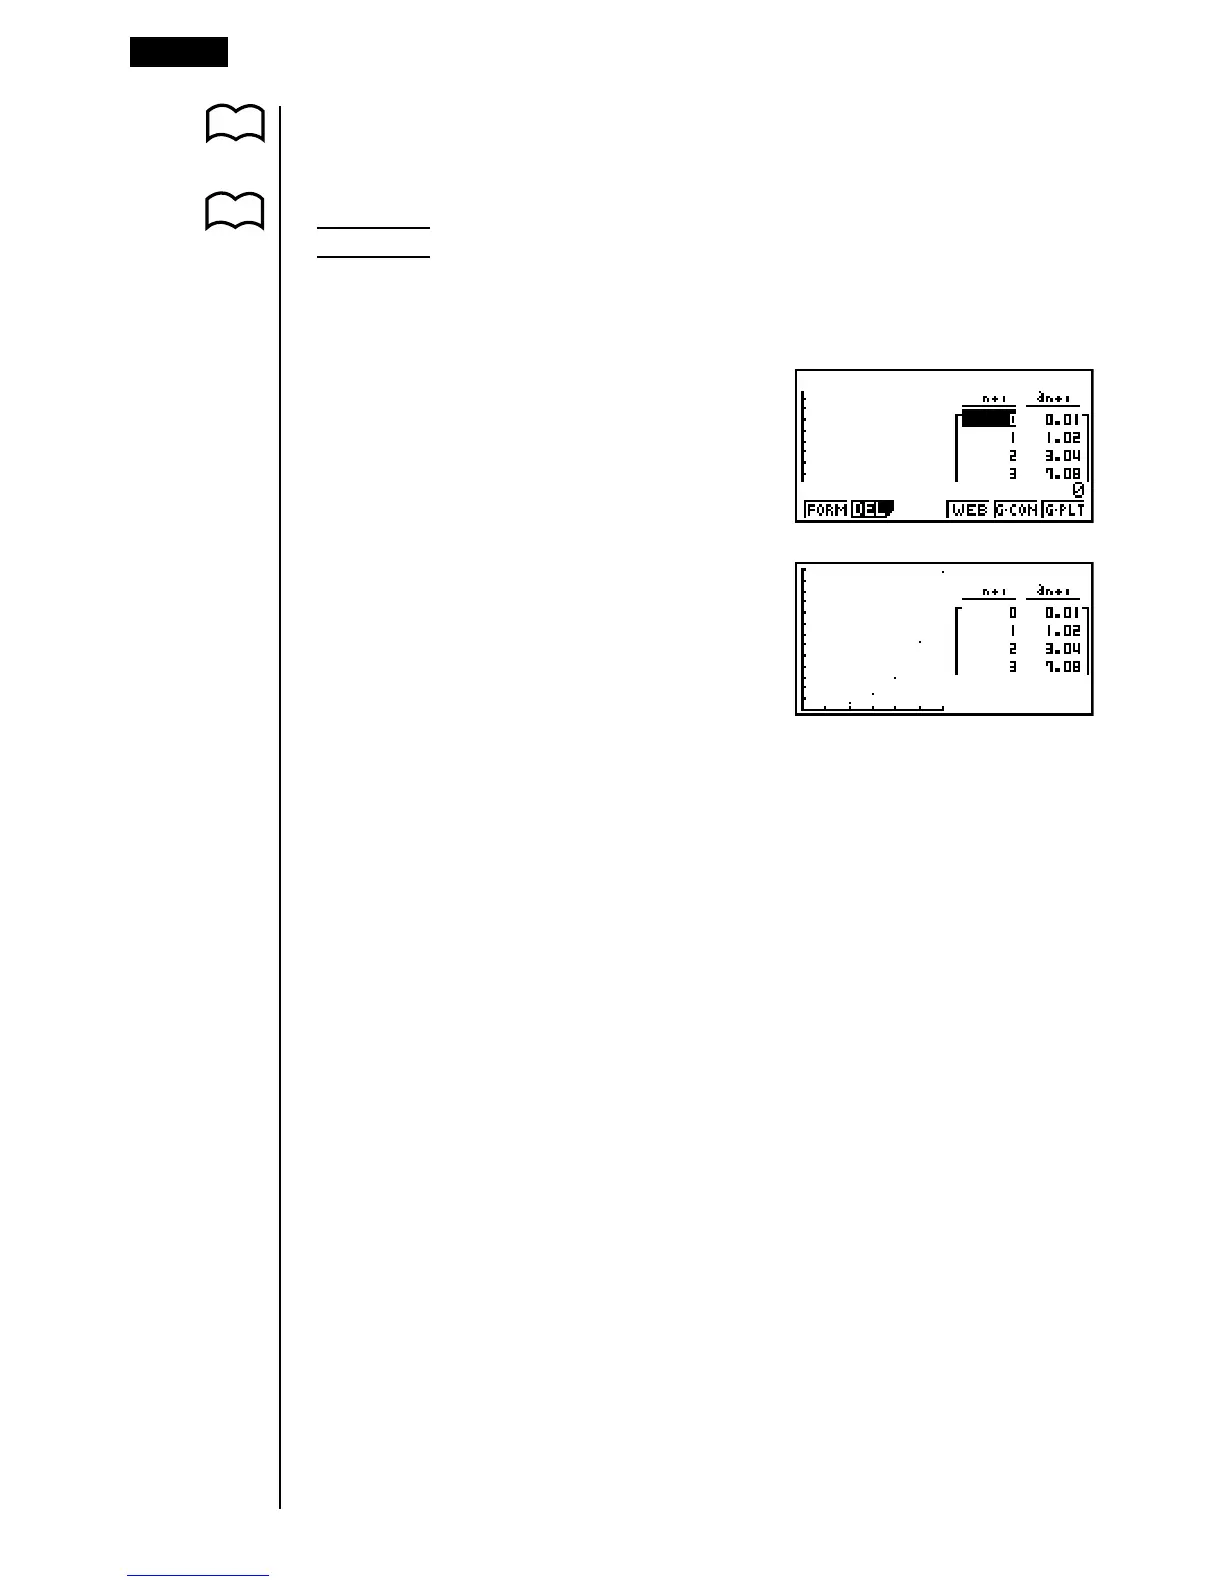
Example To draw the graph of an+1 = 2an + 1 from Example 1, displaying
both the graph and its table
Display the set up screen and specify “T+G” for Dual Screen. Press
J.
6(TABL)
(Shows the table.)
6(G·PLT)
(Draws plot type graph.)
•Pressing !6 (G↔T) causes the graph on the left side of the Dual Screen
to fill the entire display. Note that you cannot use the sketch function while a
graph is displayed using !6 (G↔T).
P.7
P. 224