256
kk
kk
k Displaying Statistical Calculation Results
Whenever you perform a regression calculation, the regression formula parameter
(such as a and b in the linear regression y = ax + b) calculation results appear on
the display. You can use these to obtain statistical calculation results.
Regression parameters are calculated as soon as you press a function key to
select a regression type while a graph is on the display.
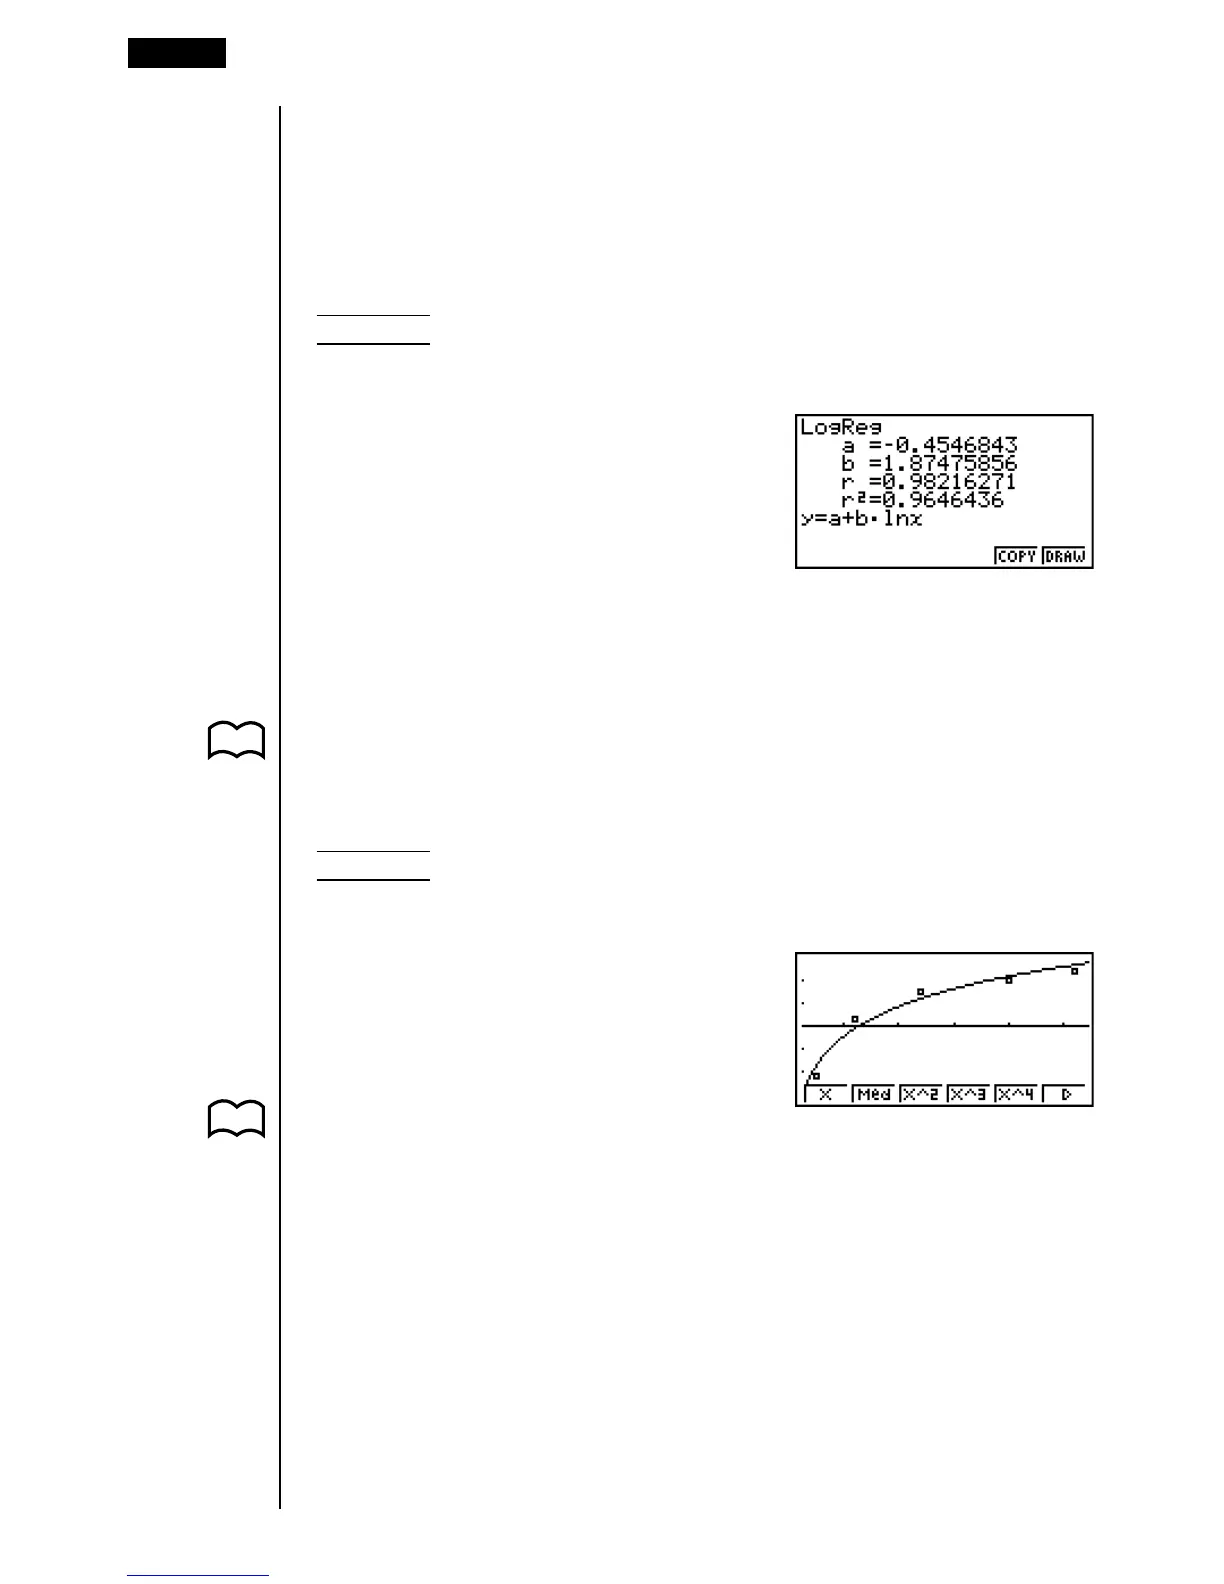
Example To display logarithmic regression parameter calculation results
while a scatter diagram is on the display
6(g)1(Log)
kk
kk
k Graphing Statistical Calculation Results
You can use the parameter calculation result menu to graph the displayed
regression formula.
P. 268 • {COPY} ... {stores the displayed regression formula as a graph function}
• {DRAW} ... {graphs the displayed regression formula}
Example To graph a logarithmic regression
While logarithmic regression parameter calculation results are on the display,
press 6 (DRAW).
P. 255 For details on the meanings of function menu items at the bottom of the display, see
“Selecting the Regression Type”.
18 - 2 Paired-Variable Statistical Calculation Examples