264
18 - 4 Calculating and Graphing Paired-Variable Statistical Data
kk
kk
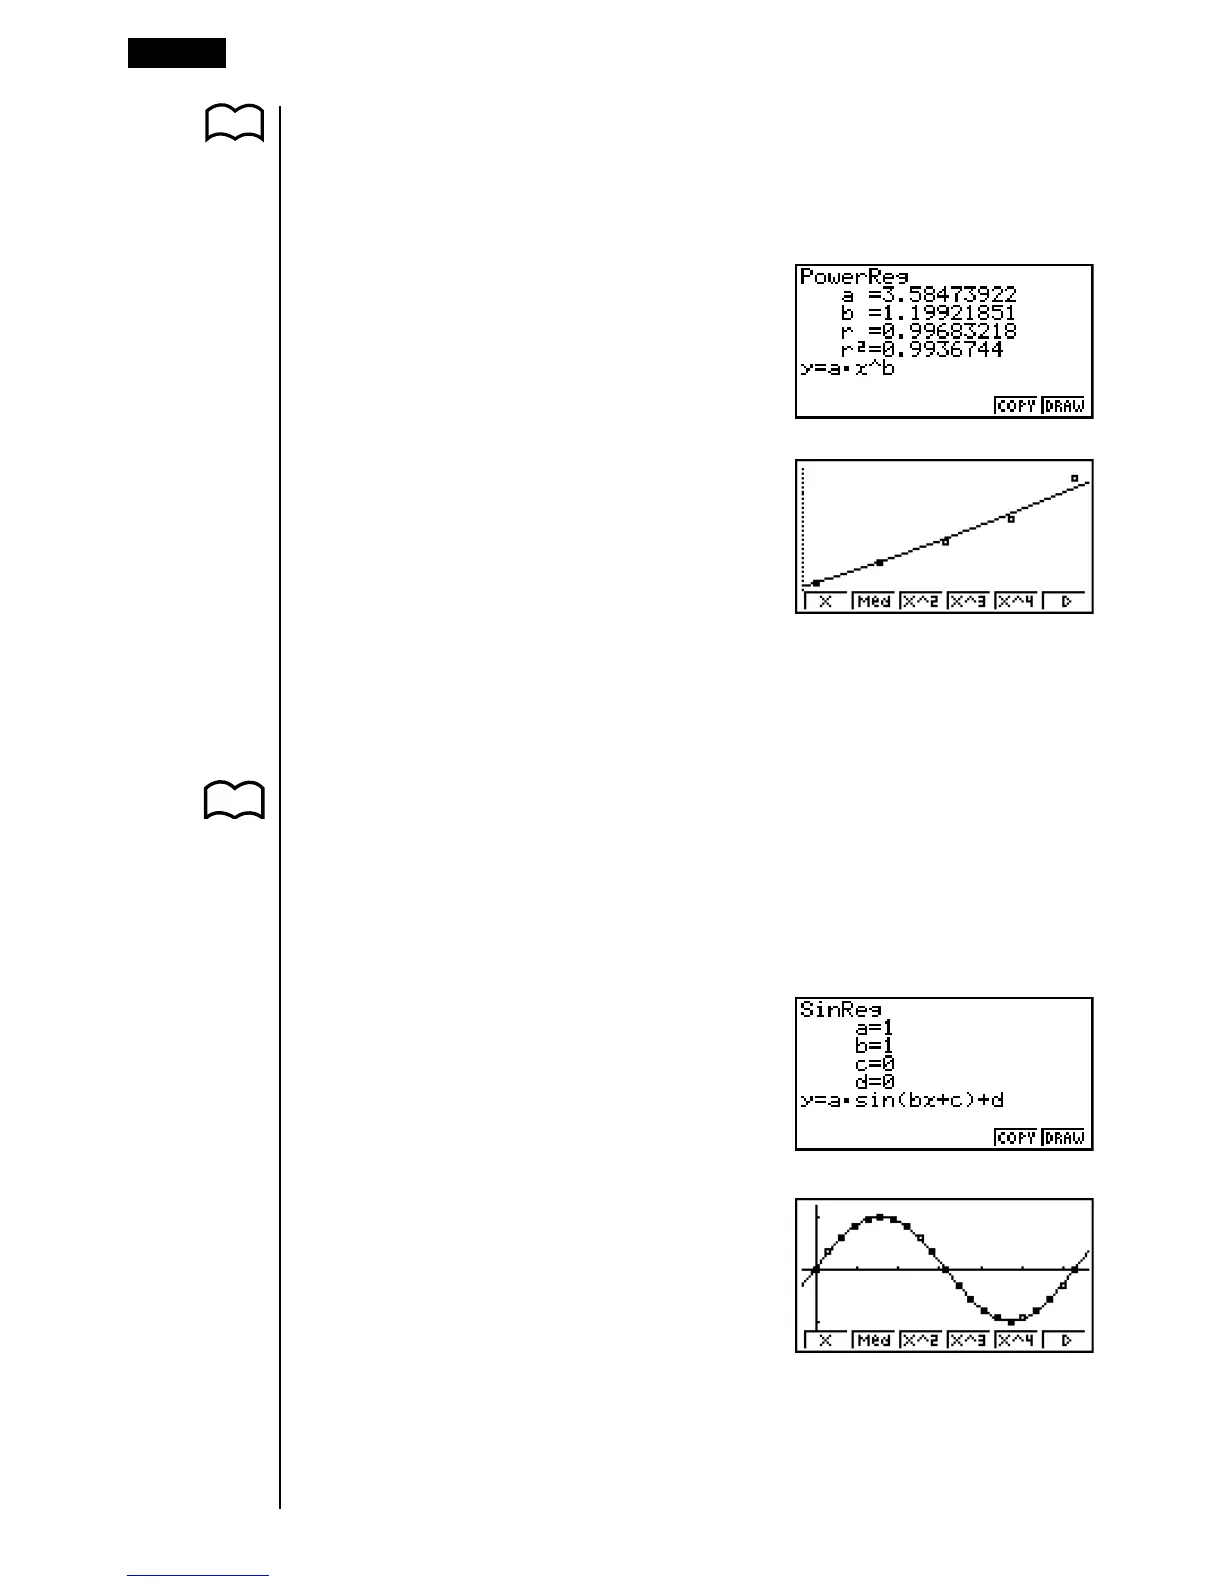
k Power Regression Graph
P.254 Exponential regression expresses y as a proportion of the power of x. The
standard power regression formula is y = a × x
b
, so if we take the logarithm of both
sides we get Iny = Ina + b × Inx. Next, if we say X = Inx, Y = Iny, and A = Ina, the
formula corresponds to linear regression formula Y = A + bX.
6(g)3(Pwr)
1 2 3 4 5
6
6(DRAW)
a ...... regression coefficient
b ...... regression power
r ...... correlation coefficient
r
2
..... coefficient of determination
kk
kk
k Sine Regression Graph
Sine regression is best applied for phenomena that repeats within a specific
range, such as tidal movements.
y = a·sin(bx + c) + d
While the statistical data list is on the display, perform the following key operation.
6(g)5(Sin)
6(DRAW)
Drawing a sine regression graph causes the angle unit setting of the calculator to
automatically change to Rad (radians). The angle unit does not change when you
perform a sine regression calculation without drawing a graph.
P. 254
6