265
Calculating and Graphing Paired-Variable Statistical Data 18 - 4
Gas bills, for example, tend to be higher during the winter when heater use is
more frequent. Periodic data, such as gas usage, is suitable for application of sine
regression.
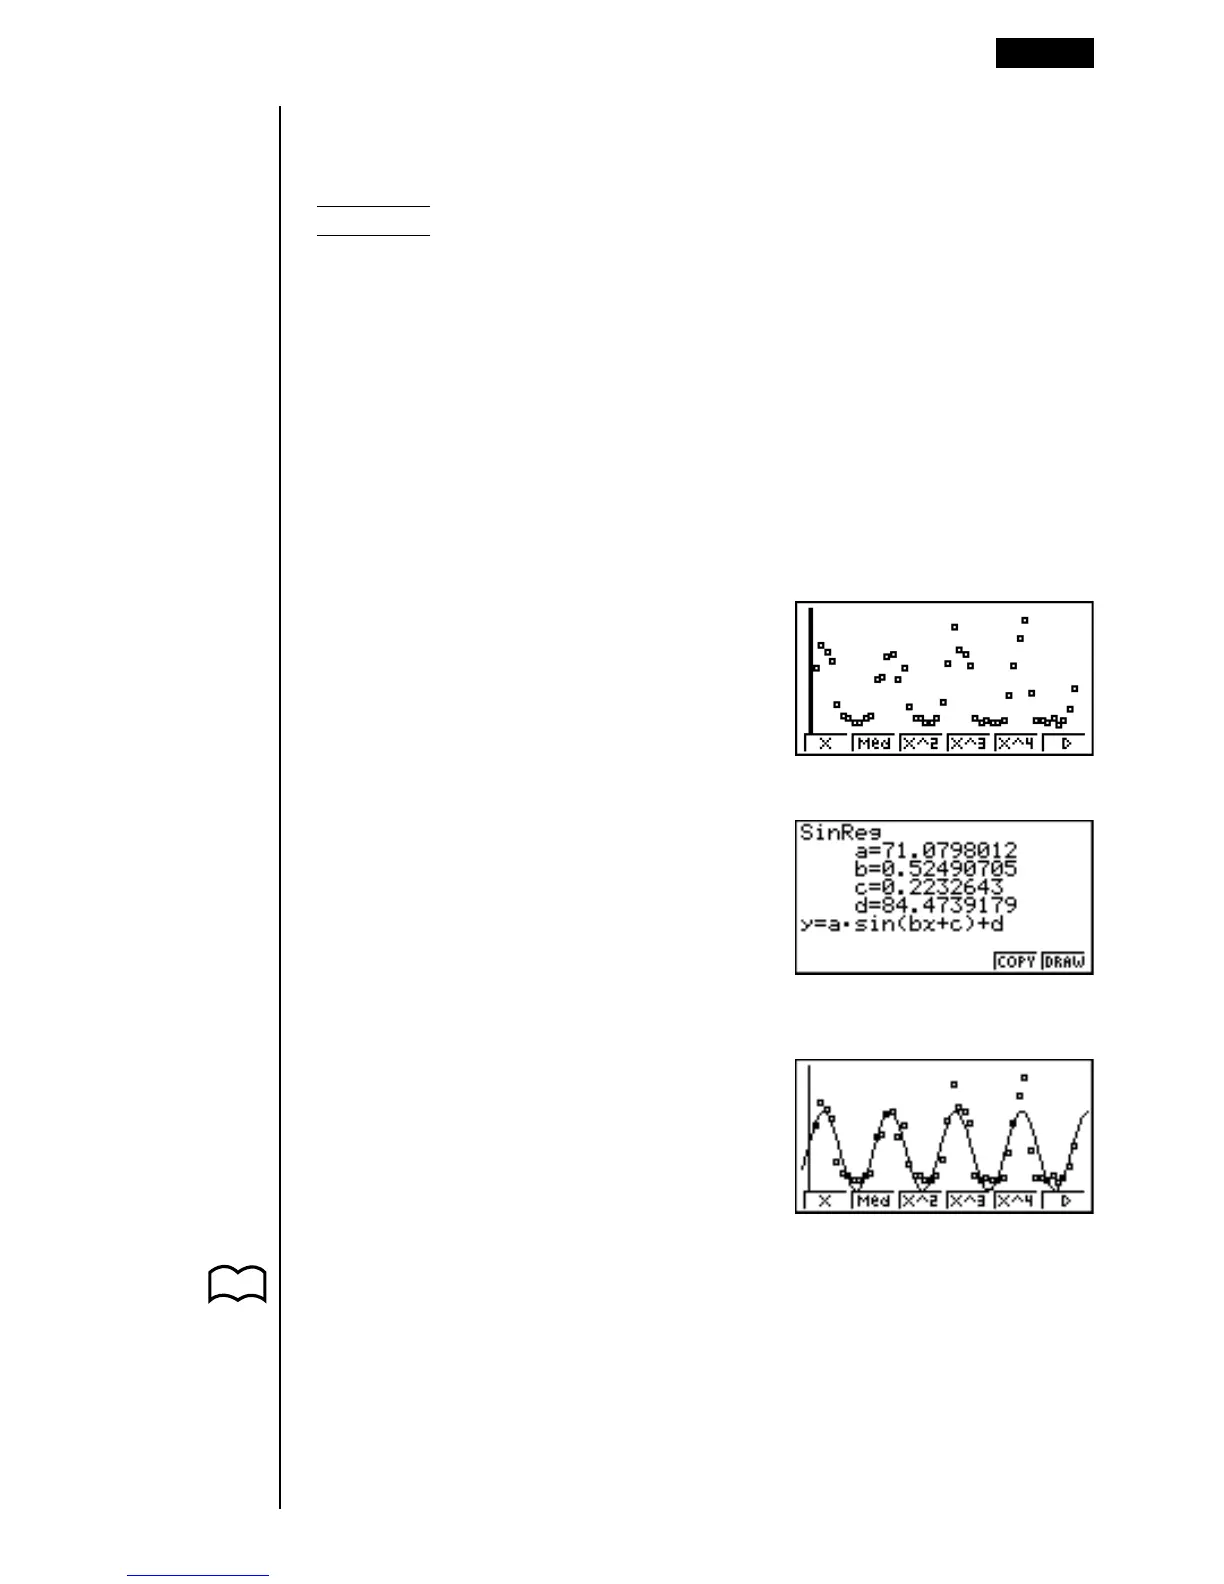
Example To perform sine regression using the gas usage data shown
below
List 1 (Month Data)
{1, 2, 3, 4, 5, 6, 7, 8, 9, 10, 11, 12, 13, 14, 15, 16, 17, 18, 19, 20, 21,
22, 23, 24, 25, 26, 27, 28, 29, 30, 31, 32, 33, 34, 35, 36, 37, 38, 39,
40, 41, 42, 43, 44, 45, 46, 47, 48}
List 2 (Gas Usage Meter Reading)
{130, 171, 159, 144, 66, 46, 40, 32, 32, 39, 44, 112, 116, 152, 157,
109, 130, 59, 40, 42, 33, 32, 40, 71, 138, 203, 162, 154, 136, 39,
32, 35, 32, 31, 35, 80, 134, 184, 219, 87, 38, 36, 33, 40, 30, 36, 55,
94}
Input the above data and plot a scatter diagram.
1(GRPH)1(GPH1)
Execute the calculation and produce sine regression analysis results.
6(g)5(Sin)
Display a sine regression graph based on the analysis results.
6(DRAW)
kk
kk
k Logistic Regression Graph
Logistic regression is best applied for phenomena in which there is a continual
increase in one factor as another factor increases until a saturation point is
reached. Possible applications would be the relationship between medicinal
dosage and effectiveness, advertising budget and sales, etc.
6
P. 254