282
The following key operations can be used to draw a graph.
J
cccc
6(DRAW)
uu
uu
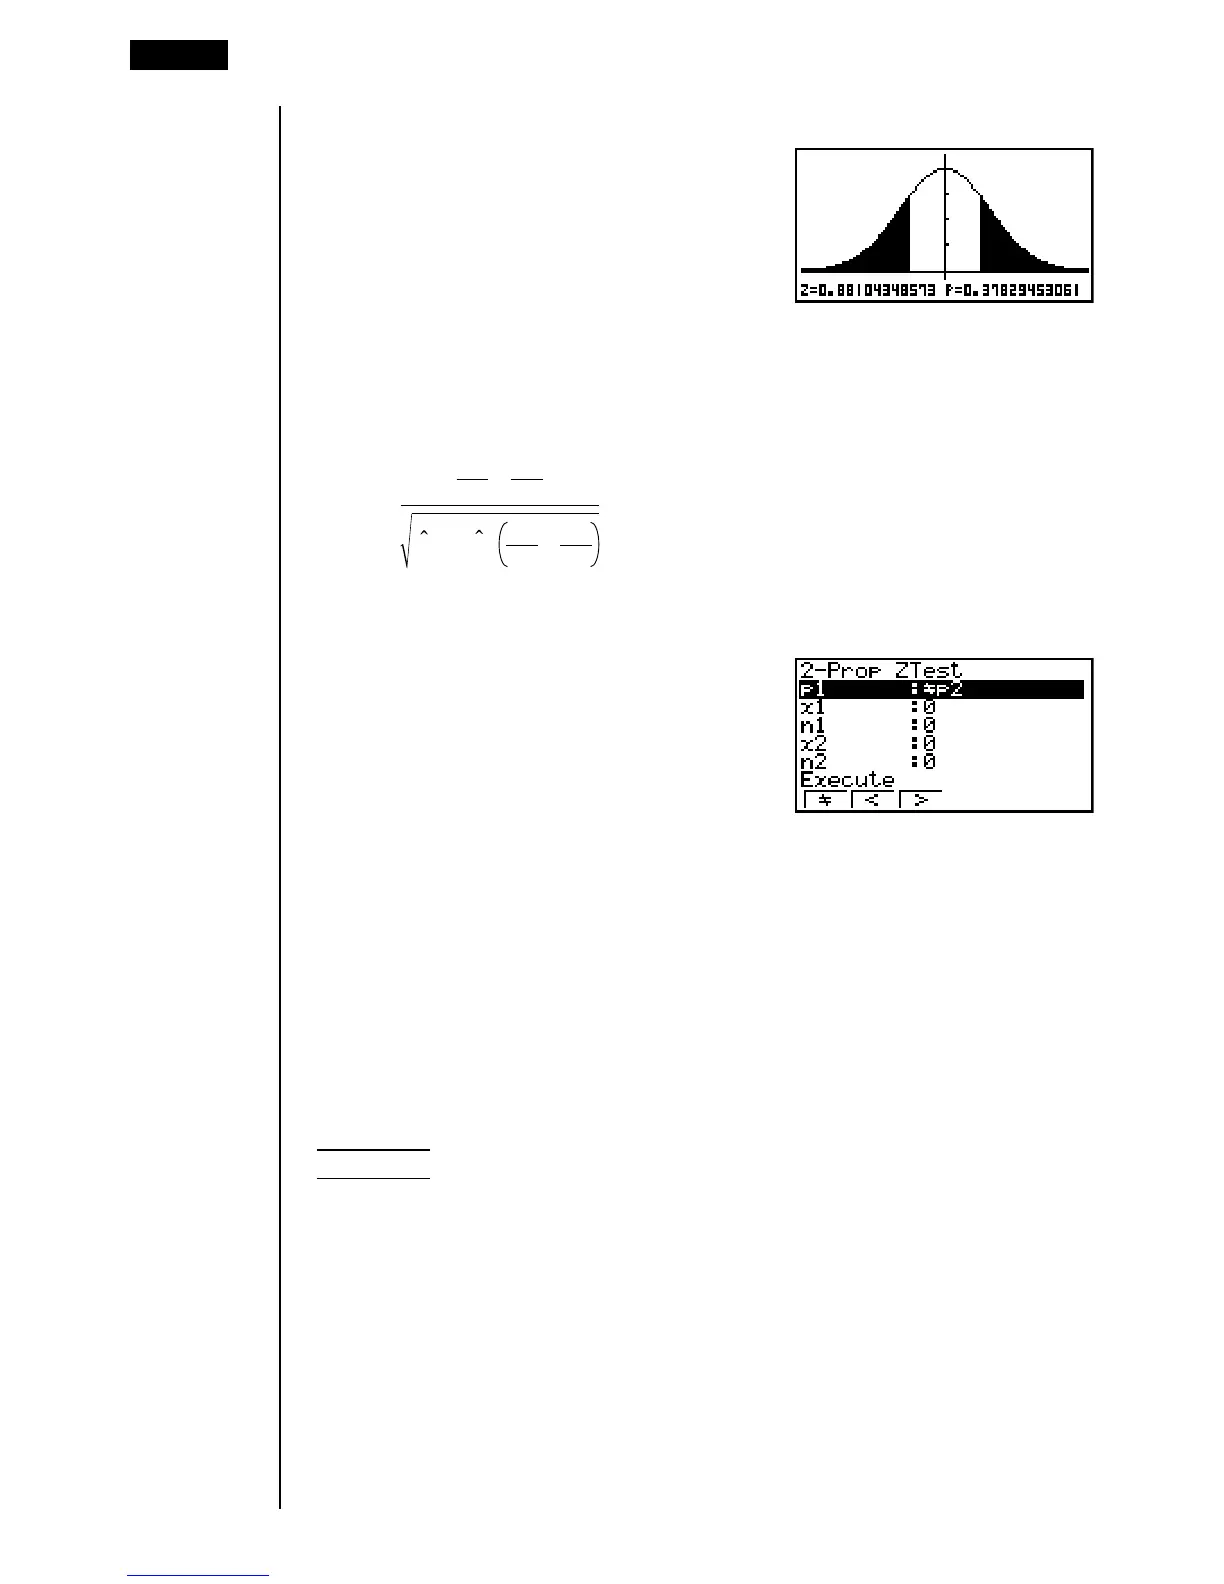
u2-Prop Z Test
This test is used to compare the proportion of successes. The 2-Prop Z Test is
applied to the normal distribution.
Z =
n
1
x
1
n
2
x
2
–
p(1 – p )
n
1
1
n
2
1
+
x1 : sample 1 data value
x2 : sample 2 data value
n1 : sample 1 size
n2 : sample 2 size
ˆp : estimated sample proportion
Perform the following key operations from the statistical data list.
3(TEST)
1(Z)
4(2-P)
p1 .................... sample proportion test conditions (“G p2” specifies two-tail
test, “< p2” specifies one-tail test where sample 1 is smaller
than sample 2, “> p2” specifies one-tail test where sample 1
is greater than sample 2.)
x1 .................... sample 1 data value (x1 > 0 integer)
n1 .................... sample 1 size (positive integer)
x2 .................... sample 2 data value (x2 > 0 integer)
n2 .................... sample 2 size (positive integer)
Execute .......... executes a calculation or draws a graph
Example To perform a p1 > p2 2-Prop Z Test for expected sample
proportions, data values, and sample sizes
Perform a p1 > p2 test using: x1 = 225, n1 = 300, x2 = 230, n2 = 300.
18 - 6 Tests