283
3(>)c
ccfw
daaw
cdaw
daaw
1(CALC)
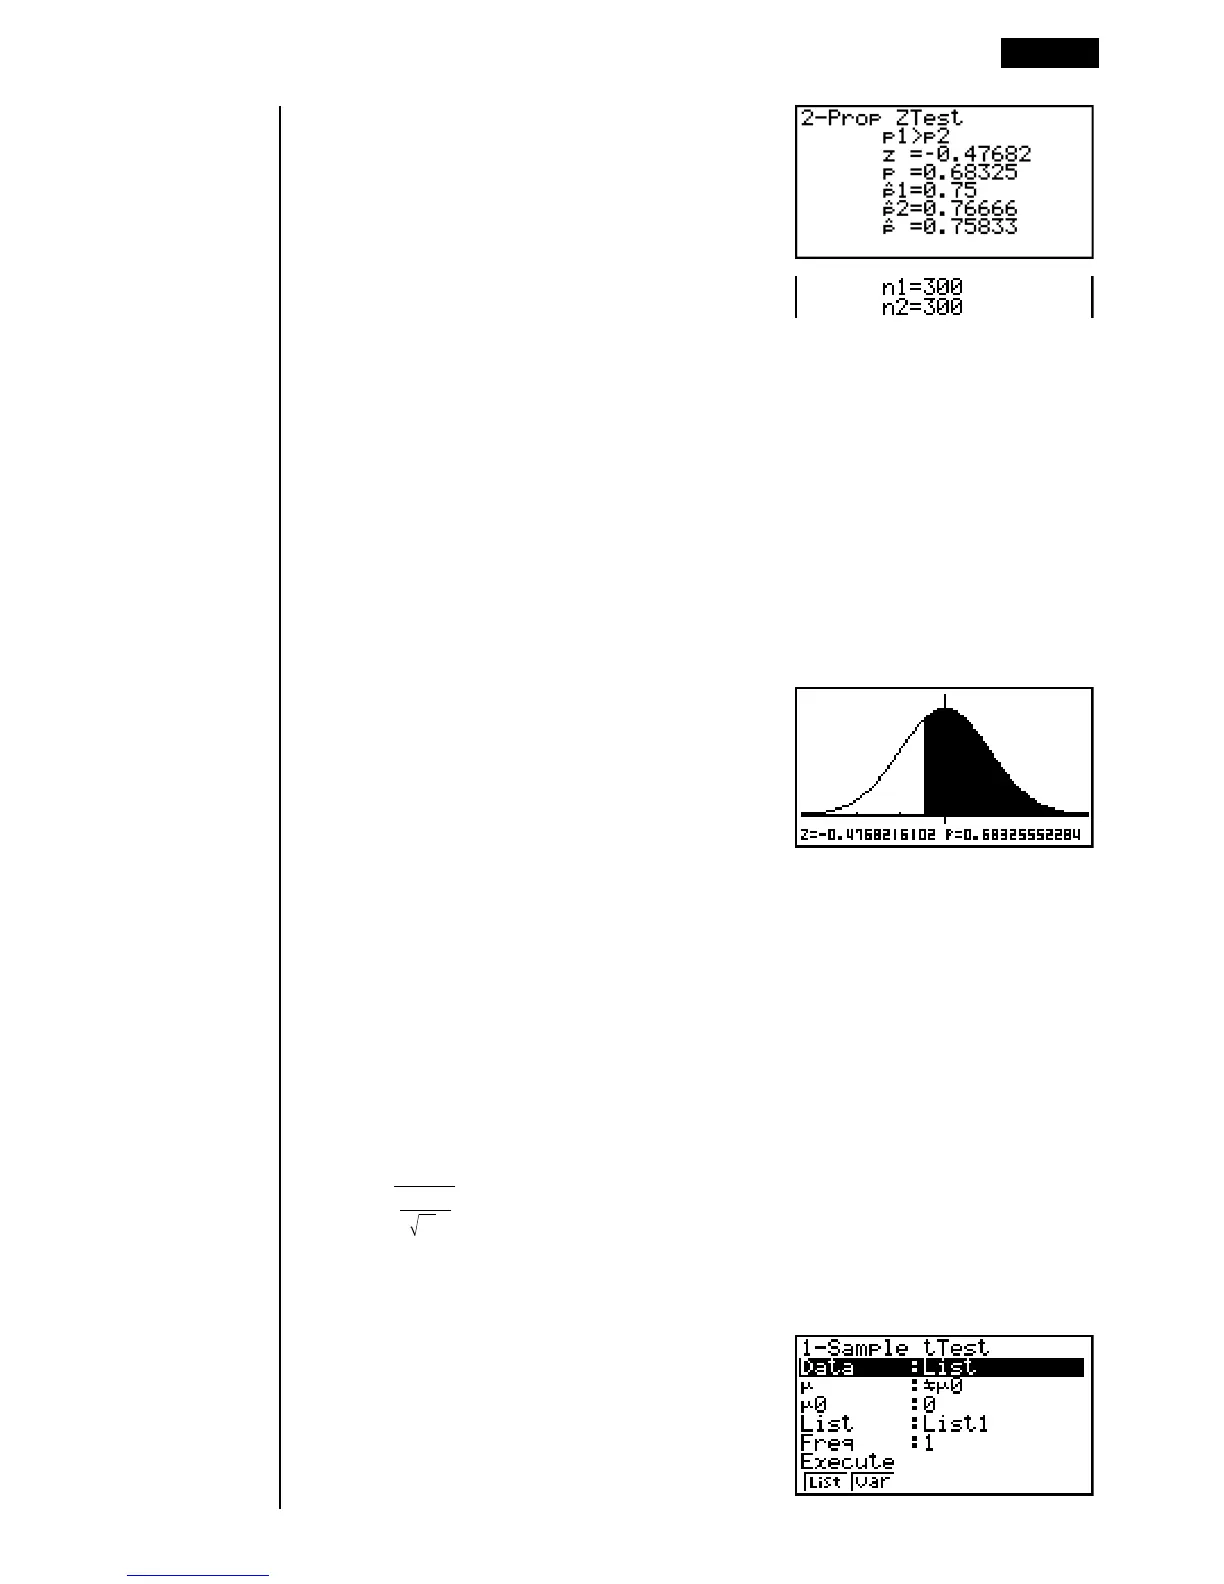
p1>p2 ............... direction of test
z ...................... z value
p ..................... p-value
ˆp 1 .................... estimated proportion of population 1
ˆp 2 .................... estimated proportion of population 2
ˆp ..................... estimated sample proportion
n1 .................... sample 1 size
n2 .................... sample 2 size
The following key operations can be used to draw a graph.
J
ccccc
6(DRAW)
kk
kk
k t Test
You can use the following menu to select a t test type.
•{1-S}/{2-S}/{REG} ... {1-Sample}/{2-Sample}/{LinearReg} t Test
uu
uu
u1-Sample t Test
This test uses the hypothesis test for a single unknown population mean when the
population standard deviation is unknown. The 1-Sample t Test is applied to t-
distribution.
t =
o –
0
µ
σ
x
n–1
n
o : sample mean
µ
0 : assumed population mean
x
σ
n-1 : sample standard deviation
n : sample size
Perform the following key operations from the statistical data list.
3(TEST)
2(t)
1(1-S)
Tests 18 - 6