396
20-
13 Using Calculator Functions in Programs
• The following is a typical graph condition specification for a regression graph.
S-Gph1 DrawOn, Linear, List1, List2, List3, Blue _
The same format can be used for the following types of graphs, by simply
replacing “Linear” in the above specification with the applicable graph type.
P. 254 Linear Regression: ......... Linear
Med-Med: ....................... Med-Med
Quadratic Regression: ... Quad
Cubic Regression: .......... Cubic
Quartic Regression: ....... Quart
Logarithmic Regression: .. Log
Exponential Regression: Exp
Power Regression: ......... Power
• The following is a typical graph condition specification for a sine regression graph.
S-Gph1 DrawOn, Sinusoidal, List1, List2, Blue _
• The following is a typical graph condition specification for a logistic regression
graph.
S-Gph1 DrawOn, Logistic, List1, List2, Blue _
Example Program
ClrGraph_
1
S-Wind Auto_
2
{1, 2, 3} → List 1_
3
{1, 2, 3} → List 2_
4 5 6 7 8
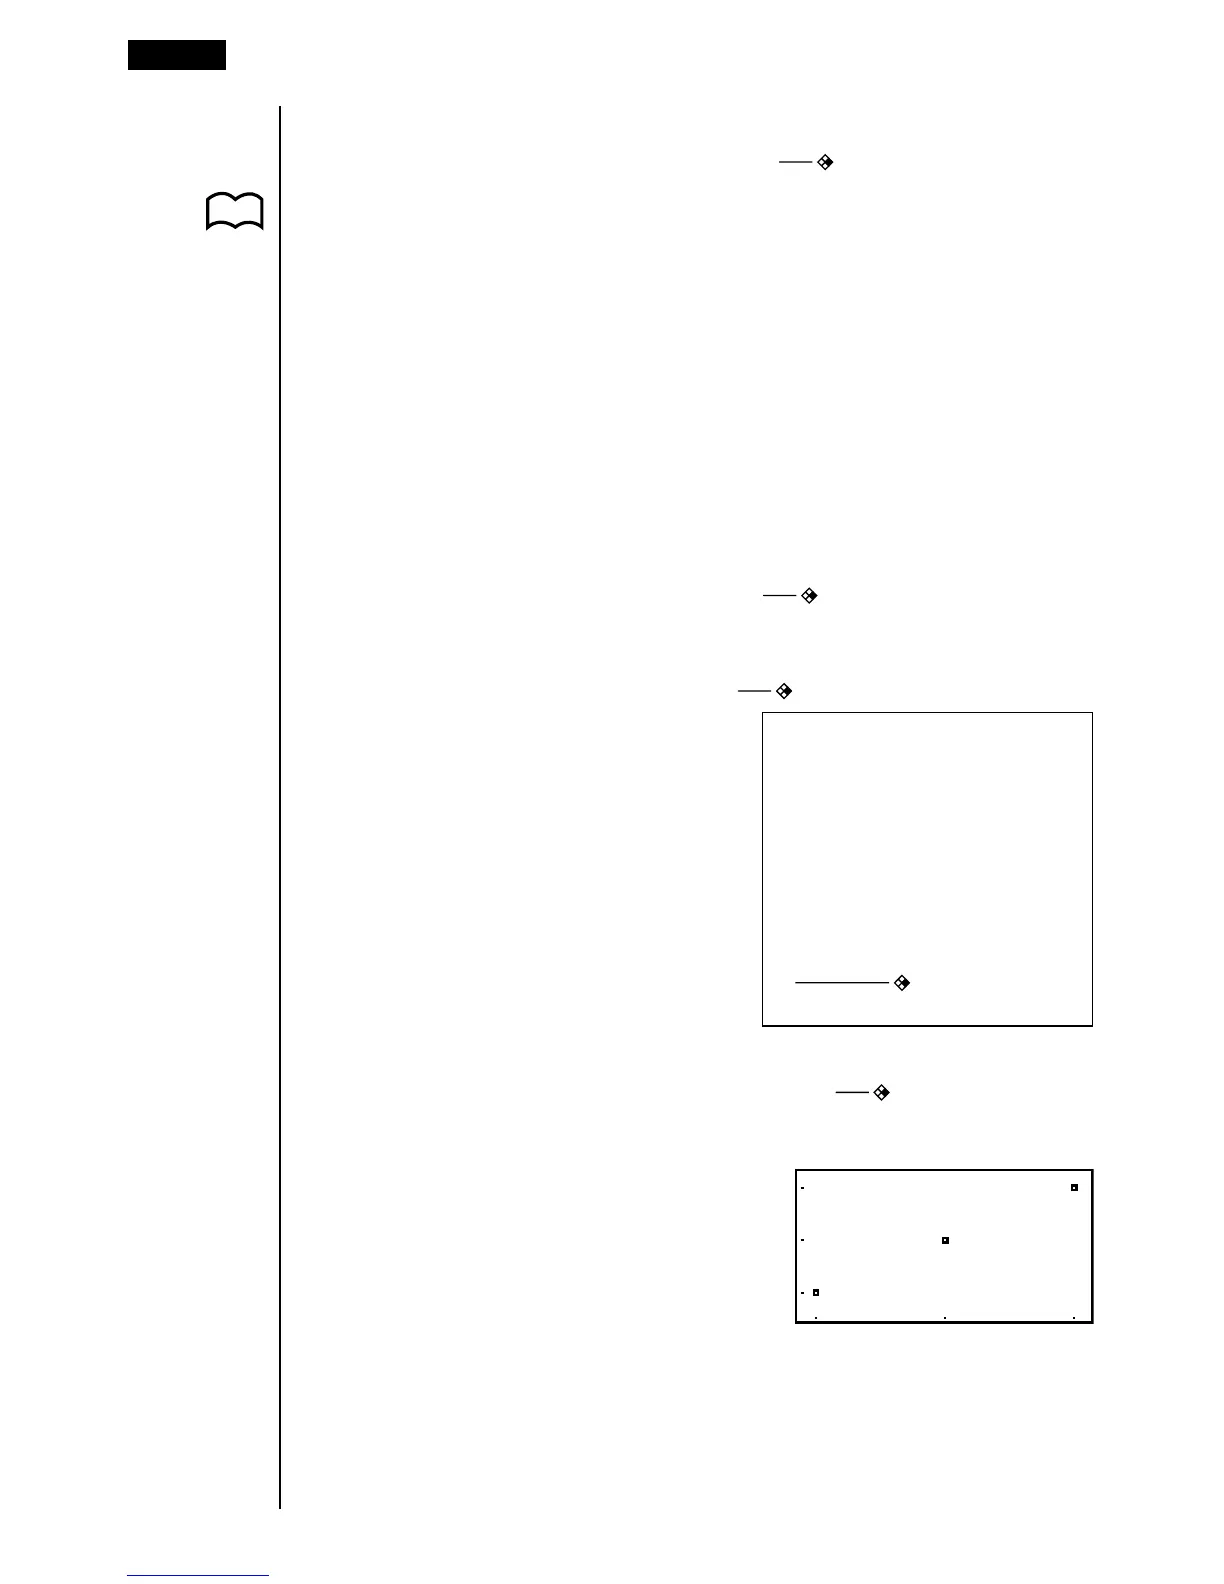
S-Gph1 DrawOn, Scatter, List1, List2, 1, Square, Blue _
9
DrawStat
Executing this program produces the scatter
diagram shown here.
1
!Z6631
2
K11
3
1JJ
4
4121J
5
11J
6
24J
7
J41
8
J51
9
!W621