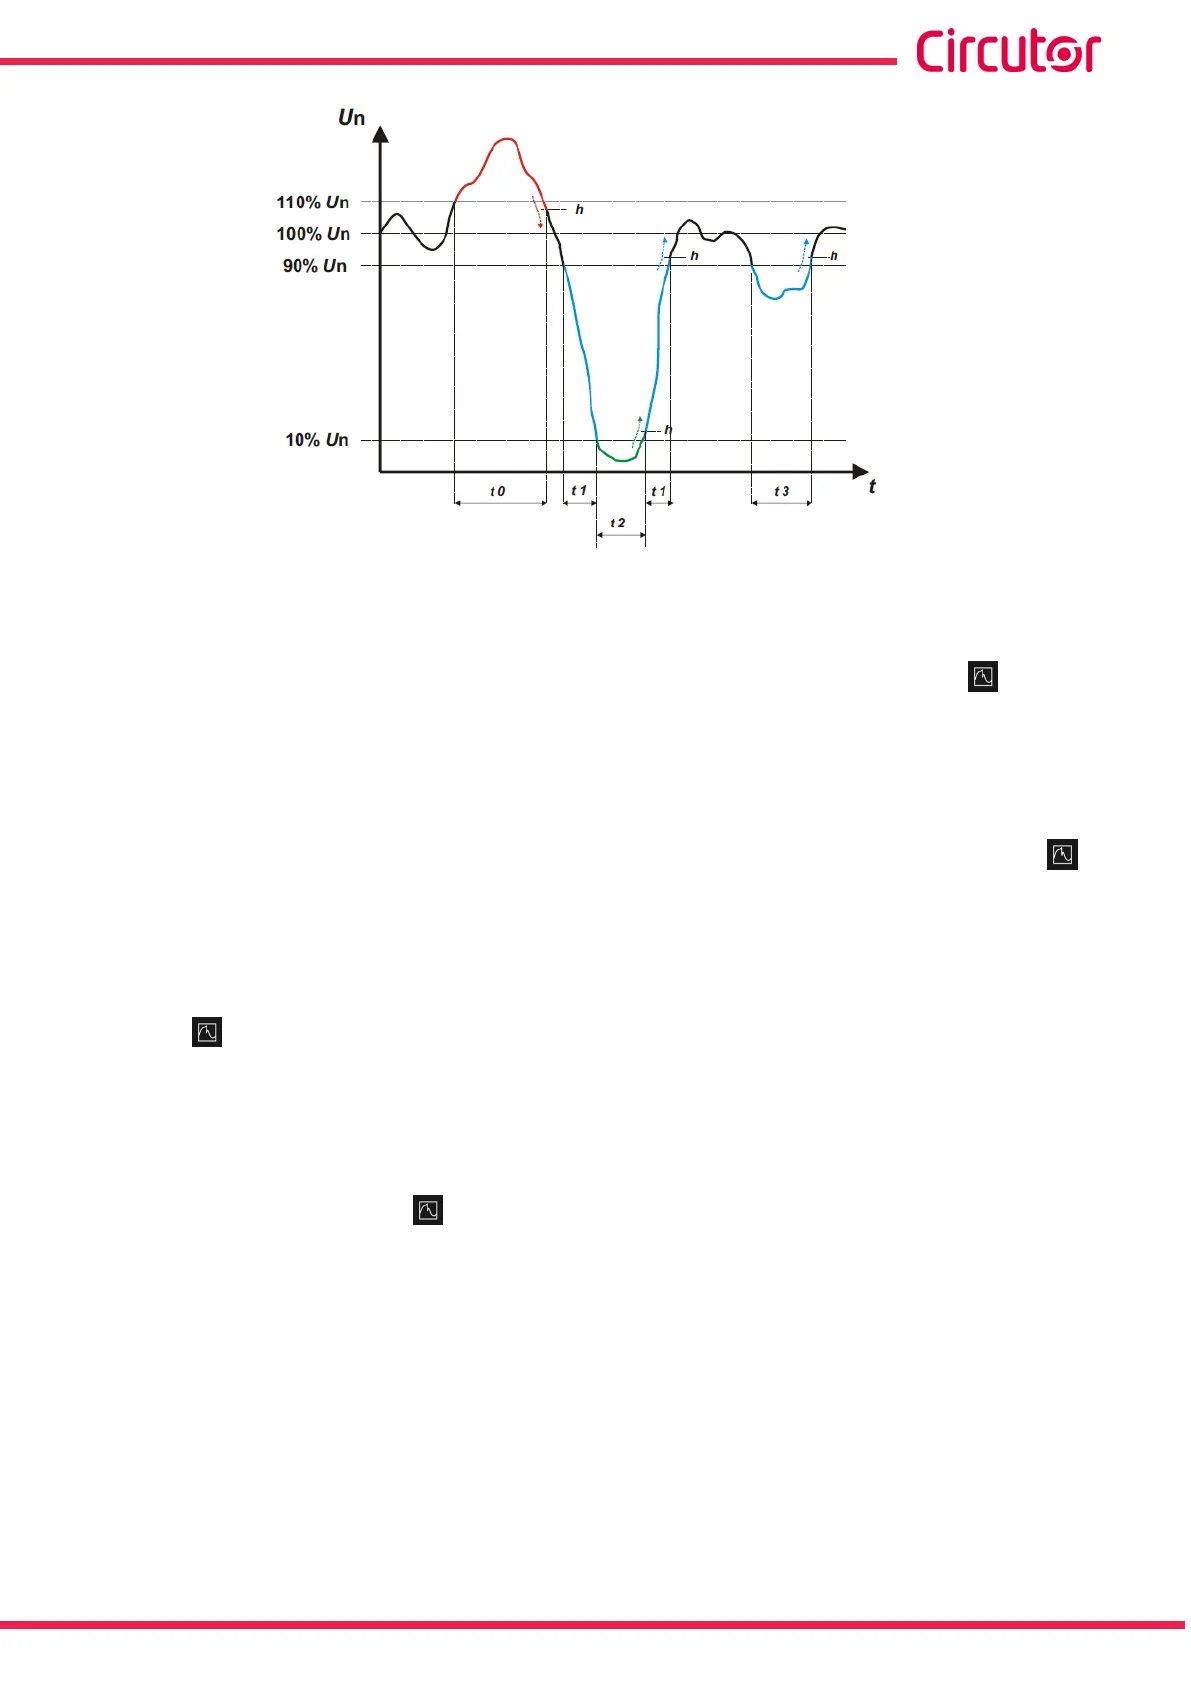
Figure 30: Example of Quality events�
Overvoltage
The t0 time interval in Figure 30 shows an overvoltage event. The duration of the event is equal
to the time during which the signal is above the congured threshold value (“5.7.9.1.- Quality
events”), in this example, it is 110% of the rated voltage, plus the time the signal takes to lower
the value, including a 2% hysteresis.
Voltage gap
The t1 and t3 time intervals in Figure 30 show the voltage gaps. The duration of the event is
equal to the time during which the signal is below the congured threshold value (“5.7.9.1.-
Quality events”), in this example, it is 90% of the rated voltage.
Voltage interrupt
The t2 time interval in Figure 30 shows an outage or interruption event. The duration of the
event is equal to the time during which the signal is below the congured threshold value
(“5.7.9.1.- Quality events”), in this example, it is 10% of the rated voltage, plus the time the
signal takes to increase the value, including a 2% hysteresis
Transients
Transients are detected by checking that the difference between a sample and the next one
does not exceed the maximum nominal ramp, multiplied by the coefcient of the distortion level
selected by the user (“5.7.9.1.- Quality events”).
In our case, 128 samples are checked per cycle.
The maximum nominal ramp is the value of the maximum tangent, calculated from a nominal
value selected by the user. By denition, this maximum ramp occurs in a sine wave at the ze-
ro-crossing point, so we calculate the sine wave value between sampling point 0 (zero-cross-
ing) and point 1 (rst sample) as the maximum ramp.
Transients are checked and saved from phase to phase. The 3 voltage phases are checked
separately and the transient that causes the 6 wave shape cycles of the variable that caused
the transient will be detected.
39
Instruction Manual
CVM-A1000 - CVM-A1500