20-2
Cisco 12000/10700 v3.1.1 Router Manager User Guide
OL-4455-01
Chapter 20 Performance Management and Historical Data
Performance Information Available Using Cisco 12000/10720 Router Manager
This chapter describes the Performance Manager application and the various historical performance
statistics available on the various objects within the Cisco 12000/10720 Router Manager.
Note Further information on Performance Manager is available in the Cisco Element Management Framework
User Guide, when required.
Performance Information Available Using Cisco 12000/10720
Router Manager
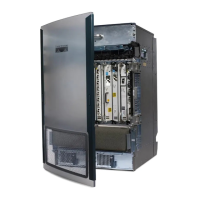
Cisco 12000/10720 Router Manager collects a variety of performance information. The performance
information collected can be viewed “real time” (as it happens), on a number of Interface Performance
windows (see Chapter 10, “Interface Performance,”), or as historical information using Performance
Manager.
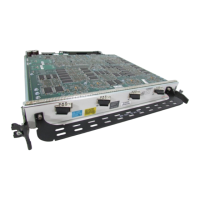
Table 20-1 summarizes the performance attributes that can be monitored for a GRP module and then
viewed using the Performance Manager application.
Viewing the Performance Manager Window
To view the Performance Manager window, proceed as follows:
Step 1 Right click (on a relevant object icon in the Map Viewer window or from an object pick list) and select
the Tools>Performance Manager... option. See Table 20-2 on page 20-2 for information on which
objects allow you to launch the Performance Manager window. The Performance Manager window
appears, with the Line Chart tab displayed:
Table 20-1 Monitored Attributes for a GRP Module
Monitored Attribute Description
CPU% performance Displays the percentage of the CPU performance for the selected
module.
CPU performance averaged over
1 minutes
Displays the percentage of the CPU utilized for the selected module,
averaged over a one minute period.
CPU performance averaged over
5 minute
Displays the percentage of the CPU utilized for the selected module,
averaged over a five minute period.
Table 20-2 Accessing Performance Manager
Objects (that can be selected) to Open the
Performance Manager Window
Menu Options to Select to Open Window
Site Chassis Module Interface
No Yes Yes Yes Tools>Performance Manager