1-15
Cisco ASR 1000 Series Aggregation Services Routers Hardware Installation Guide
OL-13208-11
Chapter 1 Cisco ASR 1000 Series Routers Hardware Overview
Functional Overview
The following is sample output of the show platform command:
Router# show platform
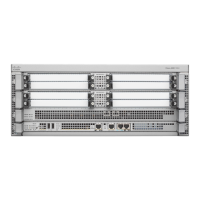
Chassis type: ASR1004
Slot Type State Insert time (ago)
--------- ------------------- --------------------- -----------------
0 MCP-CC ok 16:20:27
0/1 SPA-2XOC3-POS ok 16:18:49
0/2 SPA-4XT3/E3 ok 16:18:56
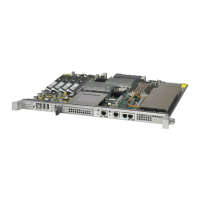
R0 ASR1000-RP1 ok, active 16:20:27
F0 ASR1000-ESP10 ok, active 16:20:27
P0 ASR1004-PWR-AC ok 16:19:27
P1 ASR1004-FAN ok 16:19:27
Slot CPLD Version Firmware Version
--------- ------------------- ---------------------------------------
0 07091401 12.2(33r)XN1
R0 0706210B 12.2(33r)XN1
F0 07051650 12.2(33r)XN1
Example 1-5 show platform software status control-processor Command
The show platform software status control-processor command displays the average load, memory
usage, and CPU utilization levels at which the router is running. The output also specifies whether the
levels of these system health parameters are within defined thresholds.
The following is sample output of the show platform software status control-processor command:
Router# show platform software status control-processor
RP0: online, statistics updated 4 seconds ago
Load Average: healthy
1-Min: 0.00, status: healthy, under 5.00
5-Min: 0.00, status: healthy, under 5.00
15-Min: 0.00, status: healthy, under 5.00
Memory (kb): healthy
Total: 8133932
Used: 1754156 (21%), status: healthy, under 90%
Free: 6379776 (78%), status: healthy, over 10%
Committed: 5059032 (62%), status: healthy, under 90%
Per-core Statistics
CPU0: CPU Utilization (percentage of time spent)
User: 0.09, System: 0.00, Nice: 0.00, Idle: 99.80
IRQ: 0.09, SIRQ: 0.00, IOwait: 0.00
CPU1: CPU Utilization (percentage of time spent)
User: 0.00, System: 0.00, Nice: 0.00, Idle:100.00
IRQ: 0.00, SIRQ: 0.00, IOwait: 0.00
ESP0: online, statistics updated 8 seconds ago
Load Average: healthy
1-Min: 0.02, status: healthy, under 5.00
5-Min: 0.02, status: healthy, under 5.00
15-Min: 0.00, status: healthy, under 5.00
Memory (kb): healthy
Total: 3895500
Used: 547868 (13%), status: healthy, under 90%
Free: 3347632 (81%), status: healthy, over 10%
Committed: 2509772 (60%), status: healthy, under 300%
Per-core Statistics
CPU0: CPU Utilization (percentage of time spent)
User: 1.20, System: 2.10, Nice: 0.00, Idle: 96.70
IRQ: 0.00, SIRQ: 0.00, IOwait: 0.00
 Loading...