Managing the System
Status
Cisco Small Business NSS300 Series Smart Storage Administration Guide 47
3
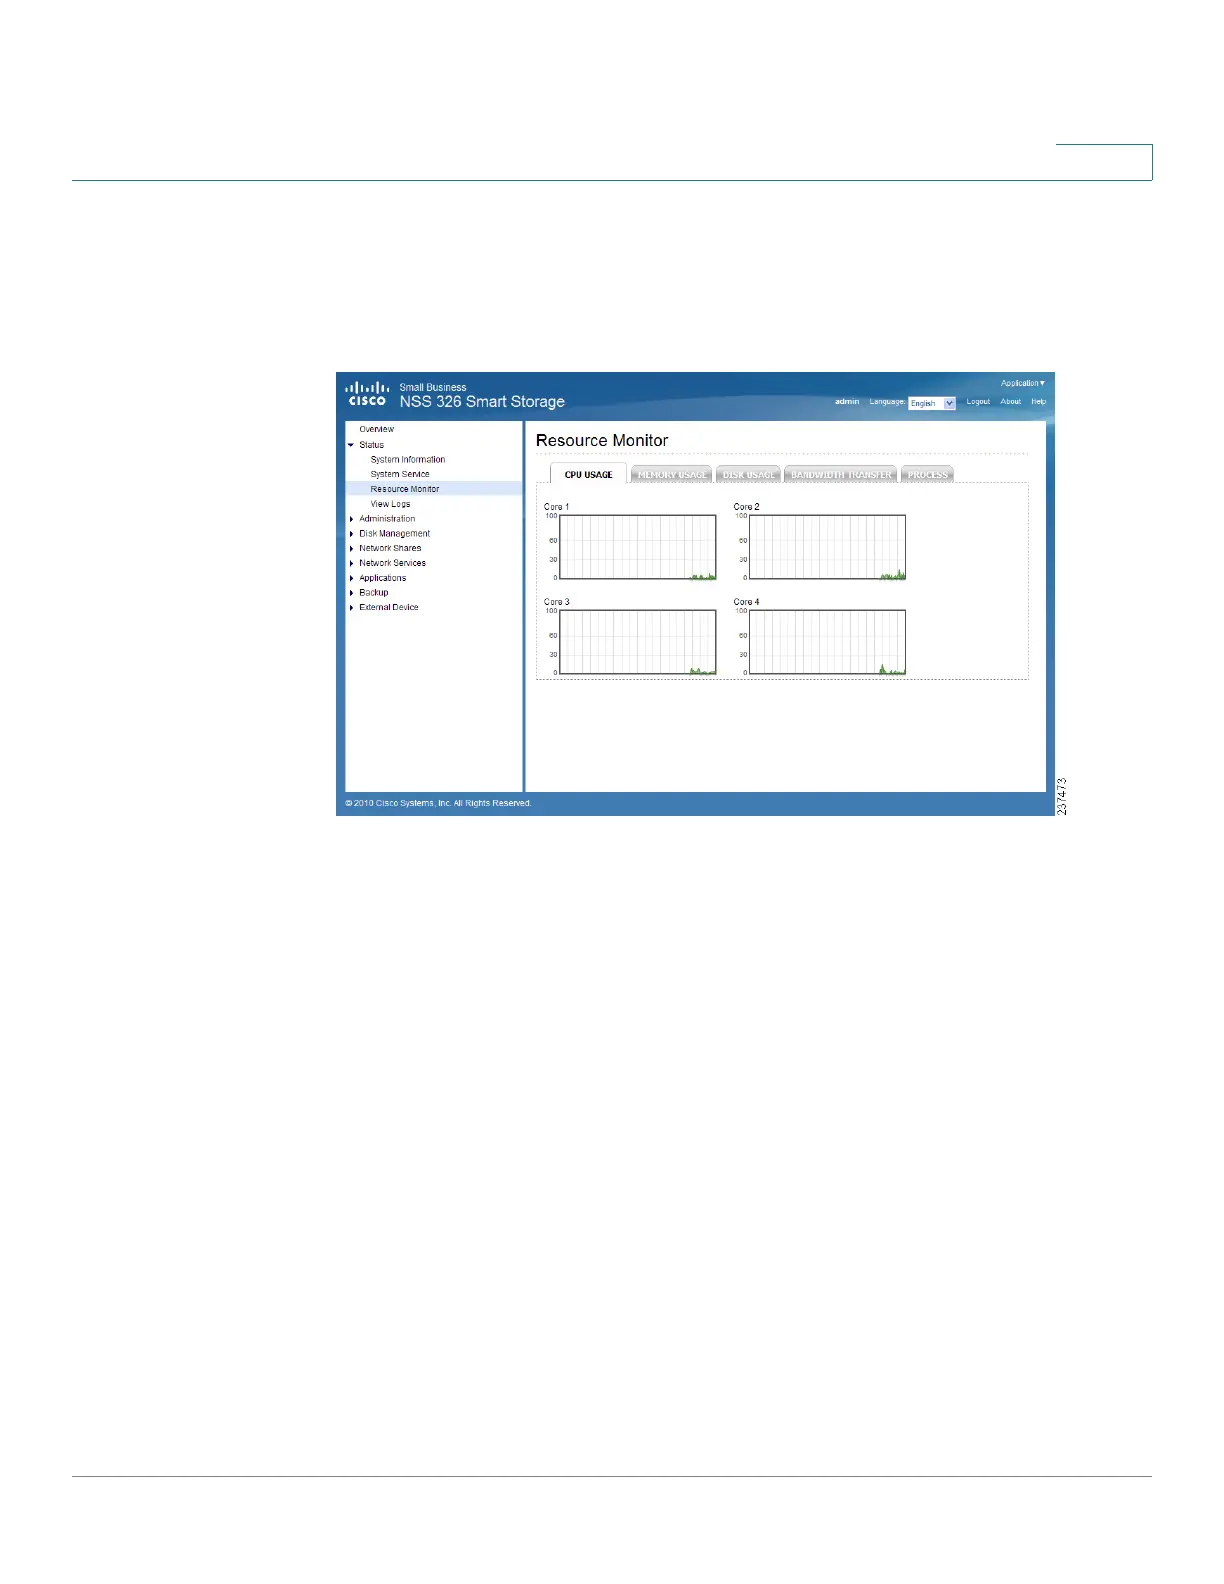
Resource Monitor
The Status > Resource Monitor window displays the CPU usage, memory usage,
disk usage, bandwidth transfer statistics, and processes running on the NAS.
• CPU Usage—Shows the percentage of CPU usage over time.
• Memory Usage—Shows the memory usage of the NAS by real-time
dynamic graph.
• Disk Usage—Shows the amount of free and used space on the NAS. The
disk space usage of each disk volume and its share folders are shown.
NOTE If a default share is less than 3 percent of the total space of a RAID
array, the disk usage will not display that share in the Disk Usage image. The
percentage will display in the image if the disk usage of a default share is
over 3 percent.
• Bandwidth Transfer—Shows the amount of in-coming and out-going
bandwidth traffic over time for each available LAN port of the NAS.
• Process—Shows information about the processes running on the NAS.