4-10
[S6] Display
Example) After executing the teach function with the 1-point Zone or 2-point Zone setting
The thresholds for the upper and lower limits are displayed.
90%
110%
100%
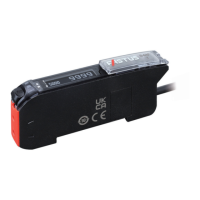
Bar graph
Displays the received light amount on a bar graph.
One or more thresholds are also displayed on the bar graph.
SP2SP1
SP1
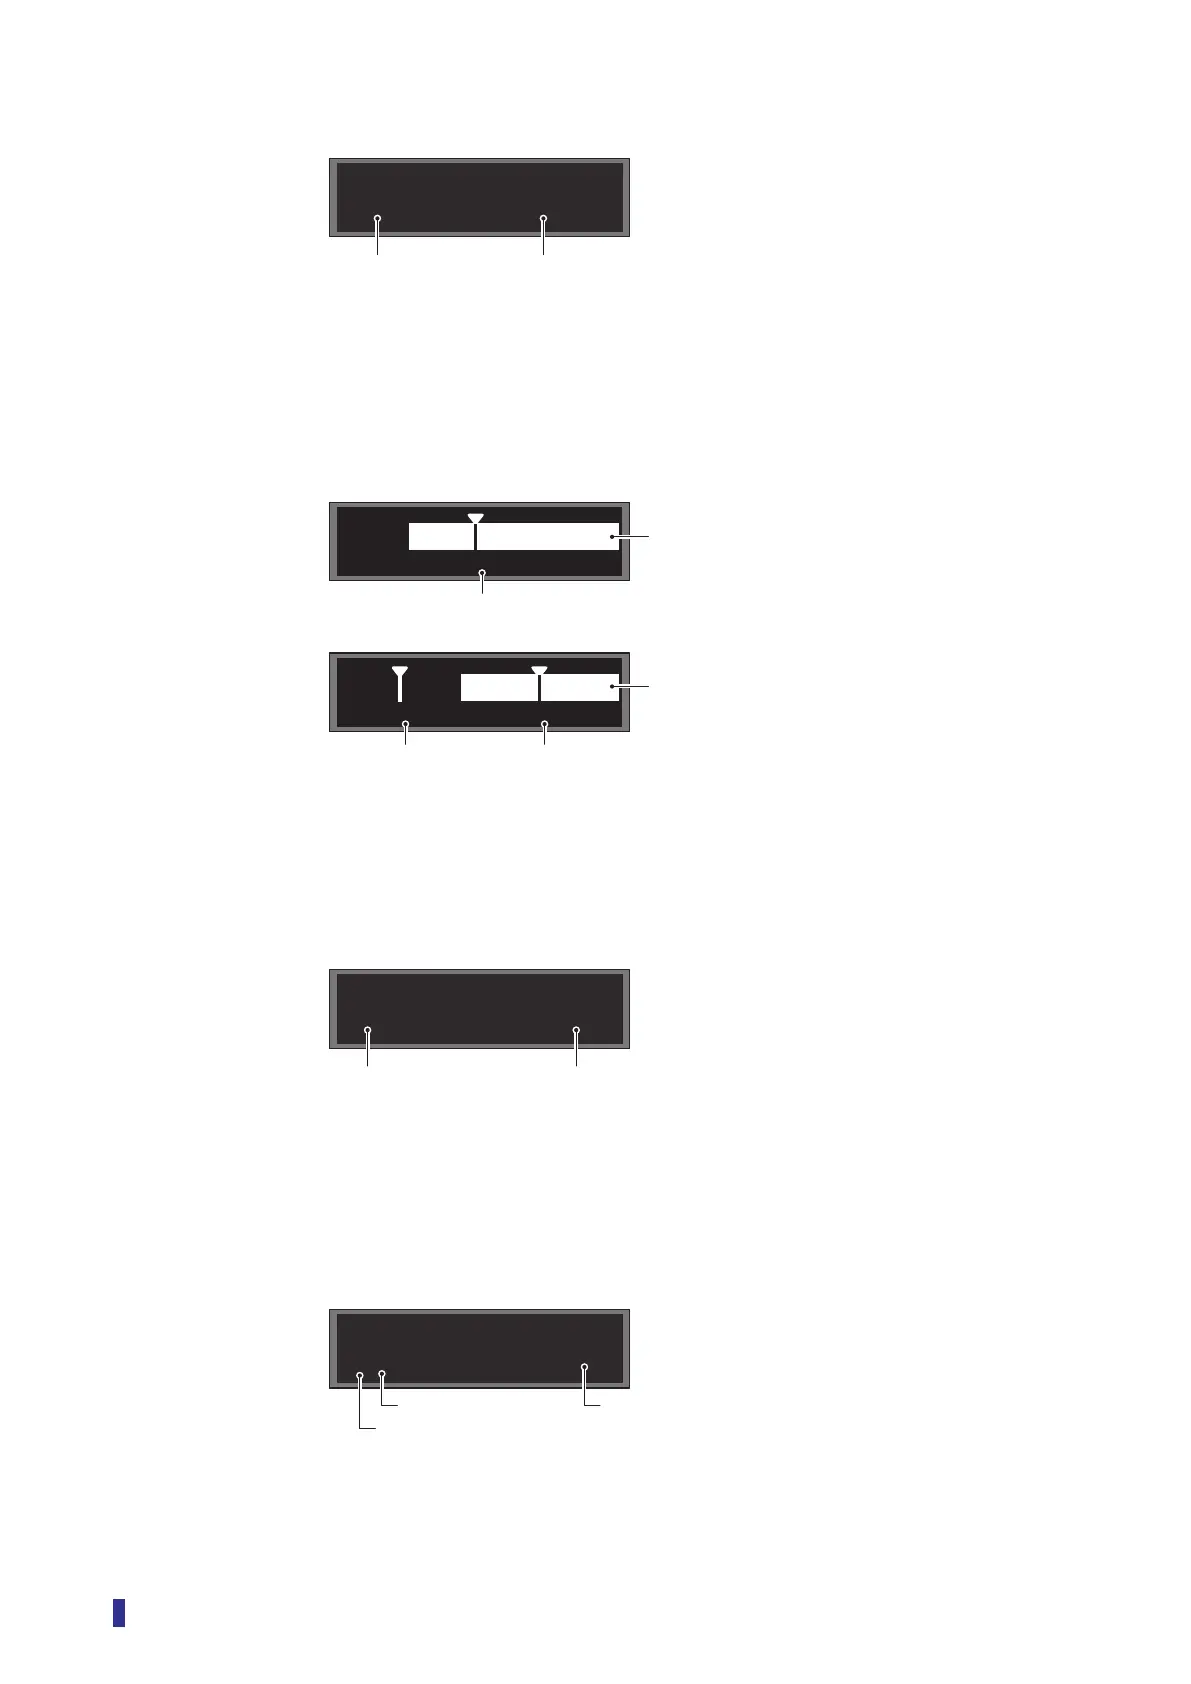
Counter
Displays the set count and the present count in Counter mode.
For details on Counter mode, refer to “4-6-6 [S7] - [D6] Counter” (page 4-19).
10
6
Edge
This is displayed when Threshold mode is set to Edge height.
When the received light amount changes, the amount of change (difference) is displayed.
For details on Edge height, refer to “3-7-5 [S7] - [D2] Threshold Mode “Edge height”” (page 3-47).
±30
85
Received light amountThresholds
Threshold (lower limit)
Teach mode: 1-point Zone and 2-point Zone
Received light amount
Threshold (upper limit)
Received light amount
Threshold
Teach mode: 1 point, 2 points, Auto, and Through
Present count
Set count
Present amount of change (difference) in the received light amount
Threshold
Edge direction (Positive: +, Negative: −, Both: ±)