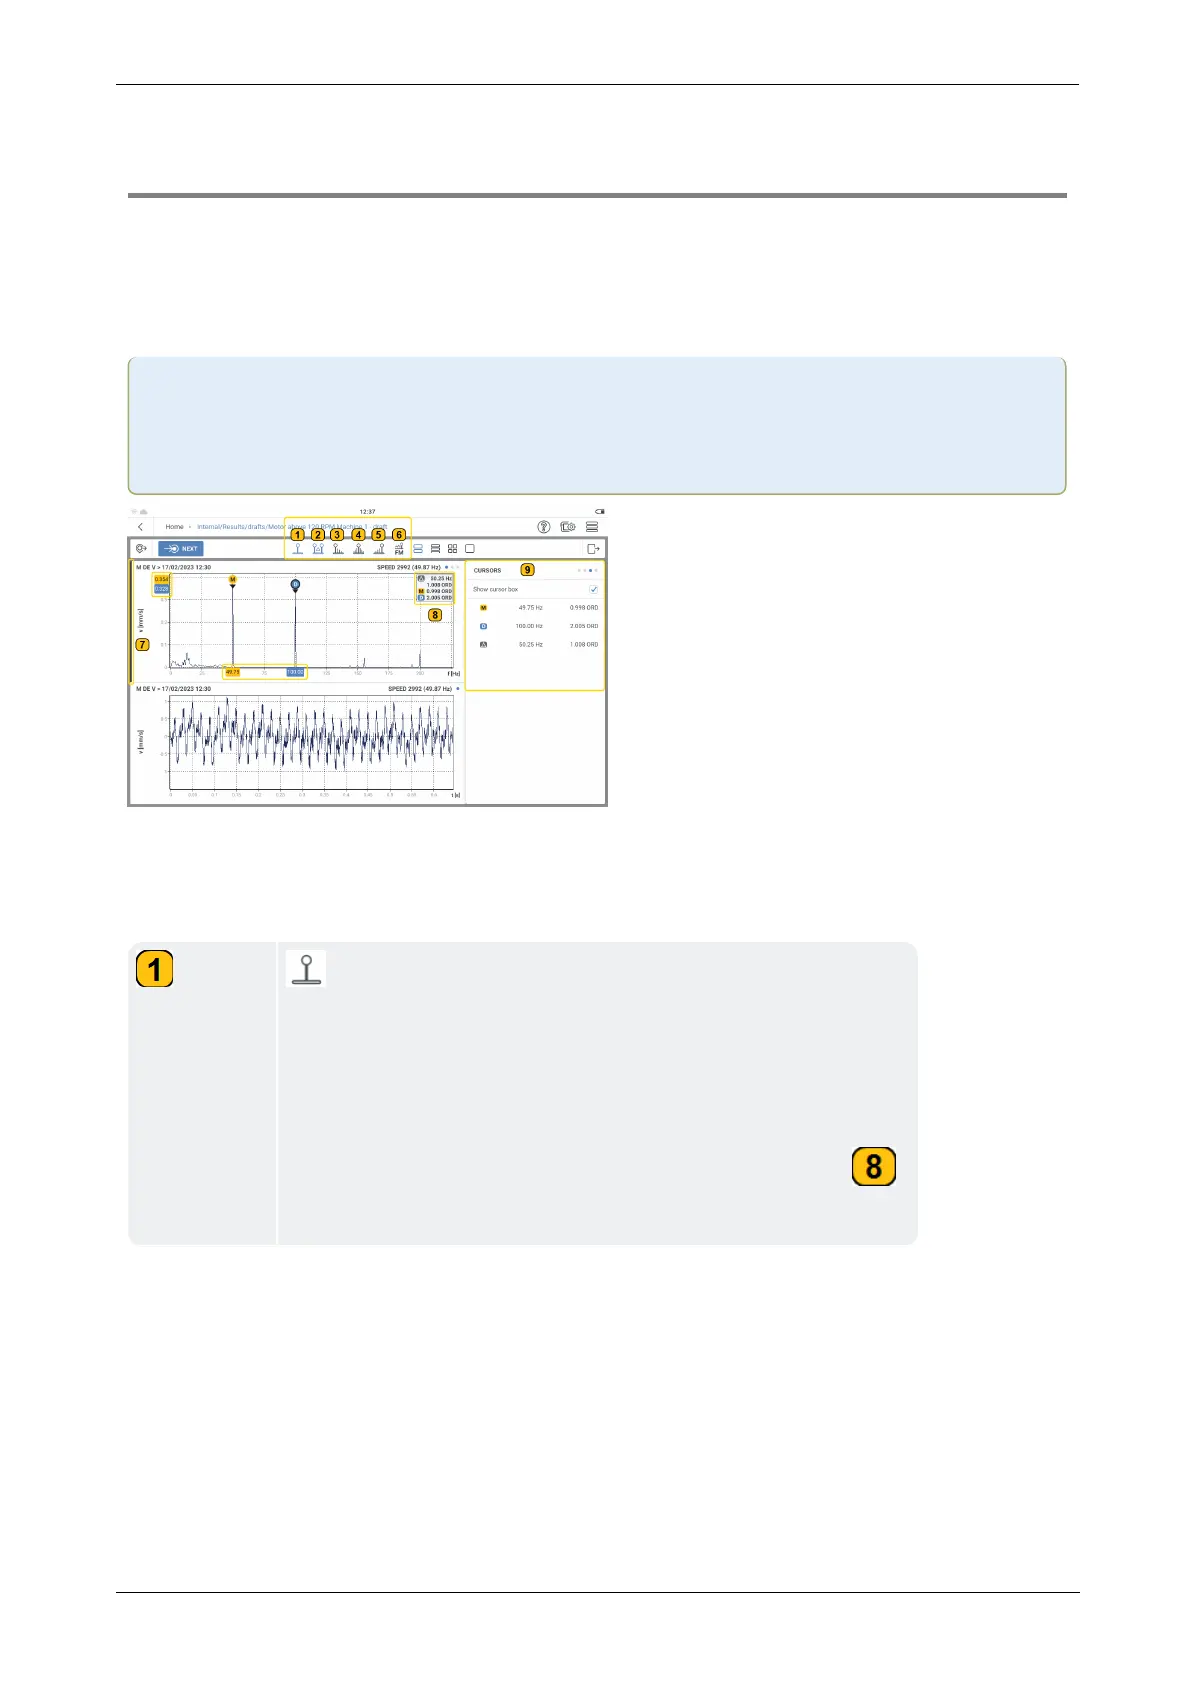
Cursor
Use the cursor
Cursor functions are used in results analysis. Cursors are used to evaluate distances in a
graph.
Note:Cursors are active only on the visible section of the graph. Use the pinch function
to zoom in and increase the size of the graph. The cursor function is active on only the
visible section of the graph.
In this example, both main and delta cursor functions have been selected. To select a cursor
function, tap the related cursor icon. This is highlighted blue.
These cursor functions are available:
– The main cursor is labeled
M
and is used in both the
spectrum and time waveform graphs. The main cursor initially
moves to the highest measured positive or negative value vis-
ible on the graph. To move the cursor, tap the required loc-
ation on the graph. The cursor moves to the highest point
within the required location. The cursor information box ( )
shows the frequency at the main cursor in orders.
96 Version:1.0
On-board help