16
D
E
C
O
O
C
D
E
O
D
E
C
A
S
O
D
E
C
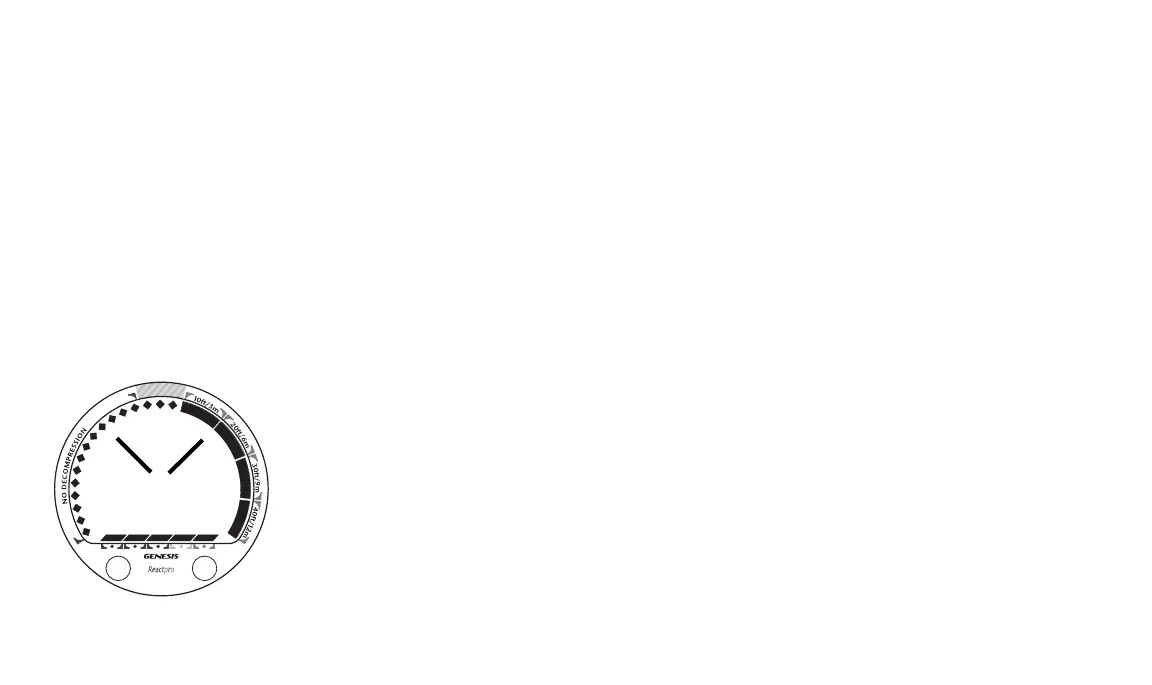
Nitrogen Bar Graph (NiBG)
The Nitrogen Bar Graph located around most of the perimeter of the LCD (Fig. 4a) represents tis-
sue loading of nitrogen, showing your relative no decompression or decompression status. As
your depth and bottom time (BT) increase, segments will add to the graph, and as you ascend to
shallower depths, the bar graph will begin to recede, indicating that additional no decompression
time is allowed for multilevel diving.
The NiBG also assists you with managing decompression by filling red 'ceiling stop required' seg-
ments which are described in more detail in the Special Situations section of this manual.
The NiBG monitors 12 different nitrogen compartments simultaneously and displays the one that
is in control of your dive at that time. It is divided into a green No Decompression zone, a yellow
Caution zone, and a red DECO (decompression) zone.
The yellow Caution zone gives a visual representation of just how close you are to the no decom-
pression limit which allows you to make a decision regarding safety stop duration or necessity.
The red DECO zone alerts you to focus your attention on the current required DECO stop 'ceiling'
depth indicated by the bar graph segment. When stop depths of 50 FT (15 M) and 60 FT (18 M)
are required, all red segments are displayed and the required stop depth (50 or 60, or 15 or 18) is
displayed numerically.
Fig. 4 - Nitrogen BG
a