44 Operation of the UL5000
iina74e 05.fm technical handbook(1408)
5.4.4 Numerical Display Mode
The display shows the leak rate in big digital figures, see Fig. 5-1. The unit of the leak
rate is shown, too. Underneath the leak rate the inlet pressure is displayed in smaller
digits. The units of leak rate and pressure can be defined in the menu (See Chapter
6.4.4 Units).
Below this the same leak rate is shown graphically as a bar. The scale of this bar, i.e.
the number of decades included in this bar can be defined in the menu (See Chapter
6.2.2 Display-range auto/manual). The programmed trigger levels (See Chapter
6.4.1 and 6.4.2) are indicated at the bar by short vertical lines: a solid line for trigger
1 and a dotted line for trigger 2.
In addition the inlet pressure is displayed in smaller figures above the bargraph.
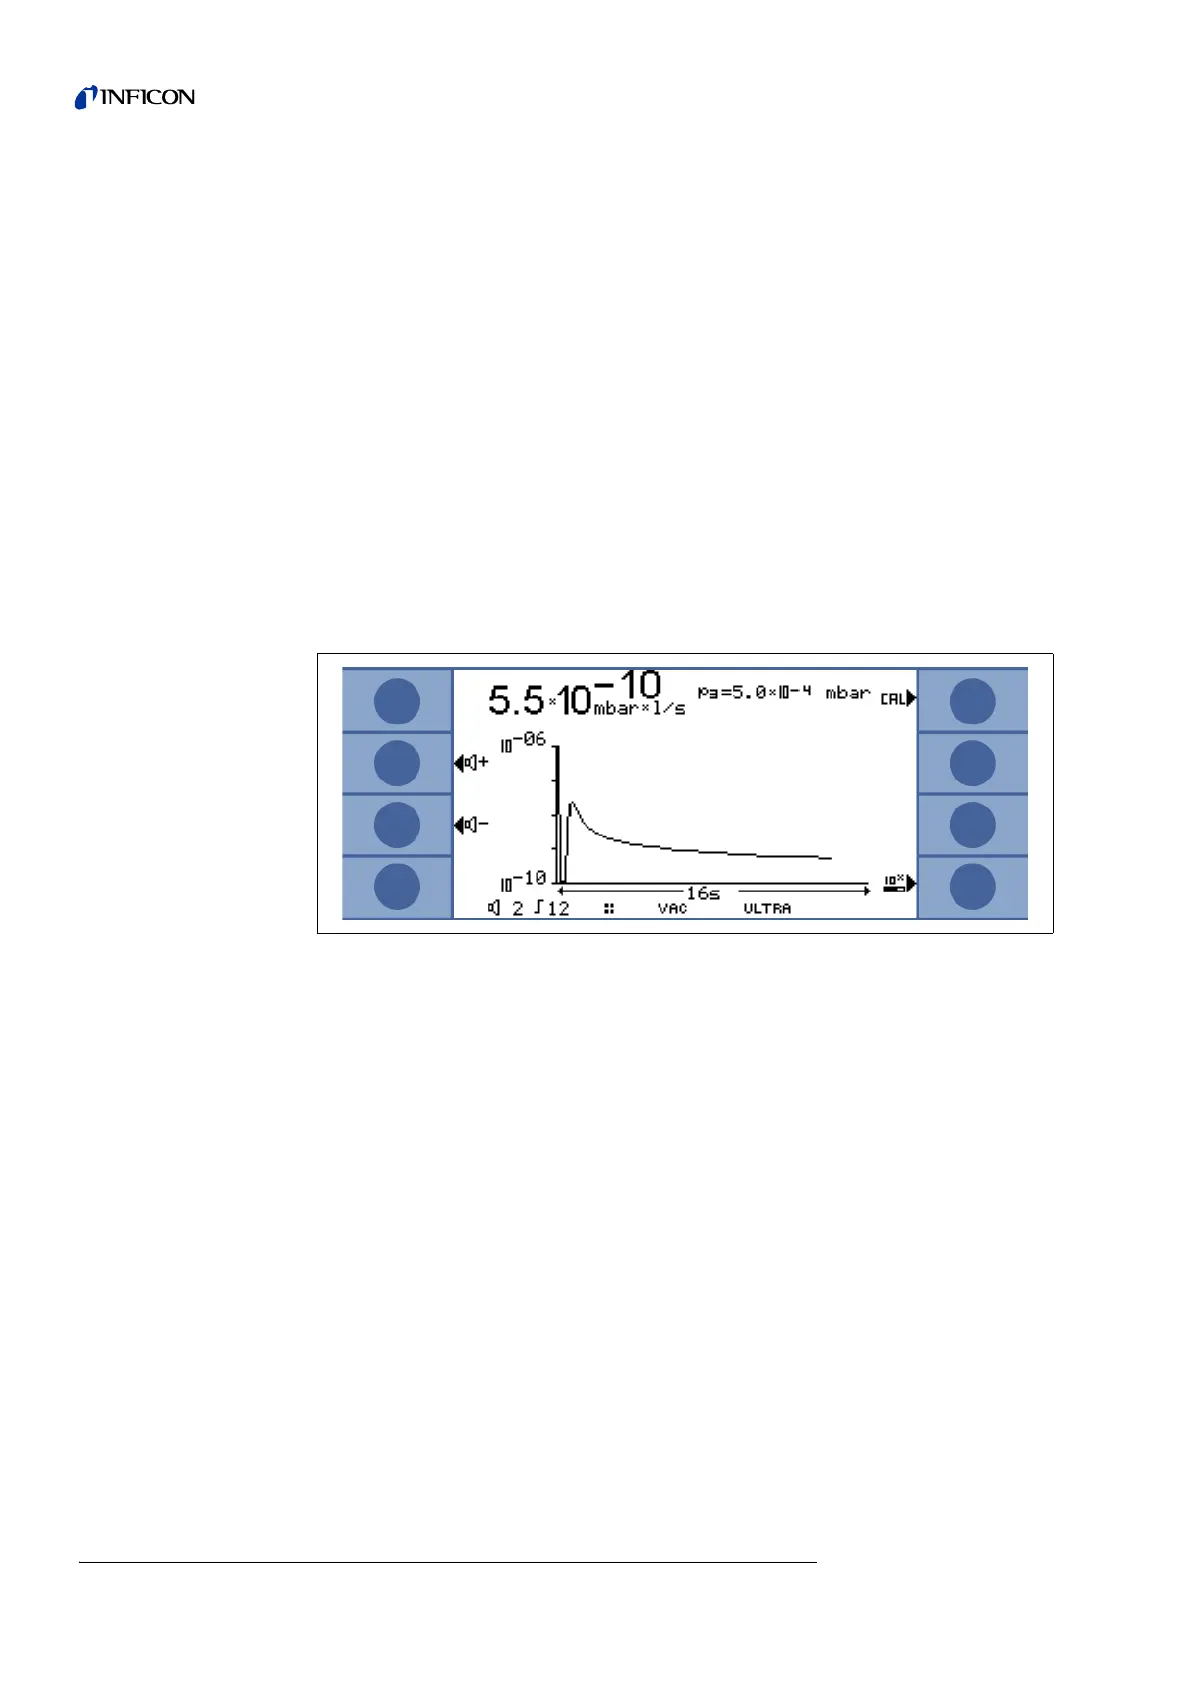
5.4.5 Trend Mode
In trend mode the leak rates are displayed over time Fig. 5-2. In addition the actual
leak rate and inlet pressure also are displayed digitally. The time axis can be defined
in the menu (See Chapter 6.2.3). The intensity axis (y-axis) is defined the same way
as the bargraph (Please refer to Chapter 6.2.1 ff).
5.4.6 HYDRO•S on / off
If working mode is set to „Vacuum: HYDRO•S: automatic ON or automatic OFF“ (See
Chapter 6.3) you can switch HYDRO•S on or off with softkey 4. If HYDRO•S is on,
the status line indicates „HYDRO•S“, if HYDRO•S is off, the status line indicates
„VAC“. Also refer to Chapter 6.6.1.4
Notice: In the HYDRO•S mode the lower detection limit is 1 x 10
-10
mbar l/s
Fig. 5-2: Display, trend mode