Description of the Menu 47
iina74e 06.fm technical handbook(1408)
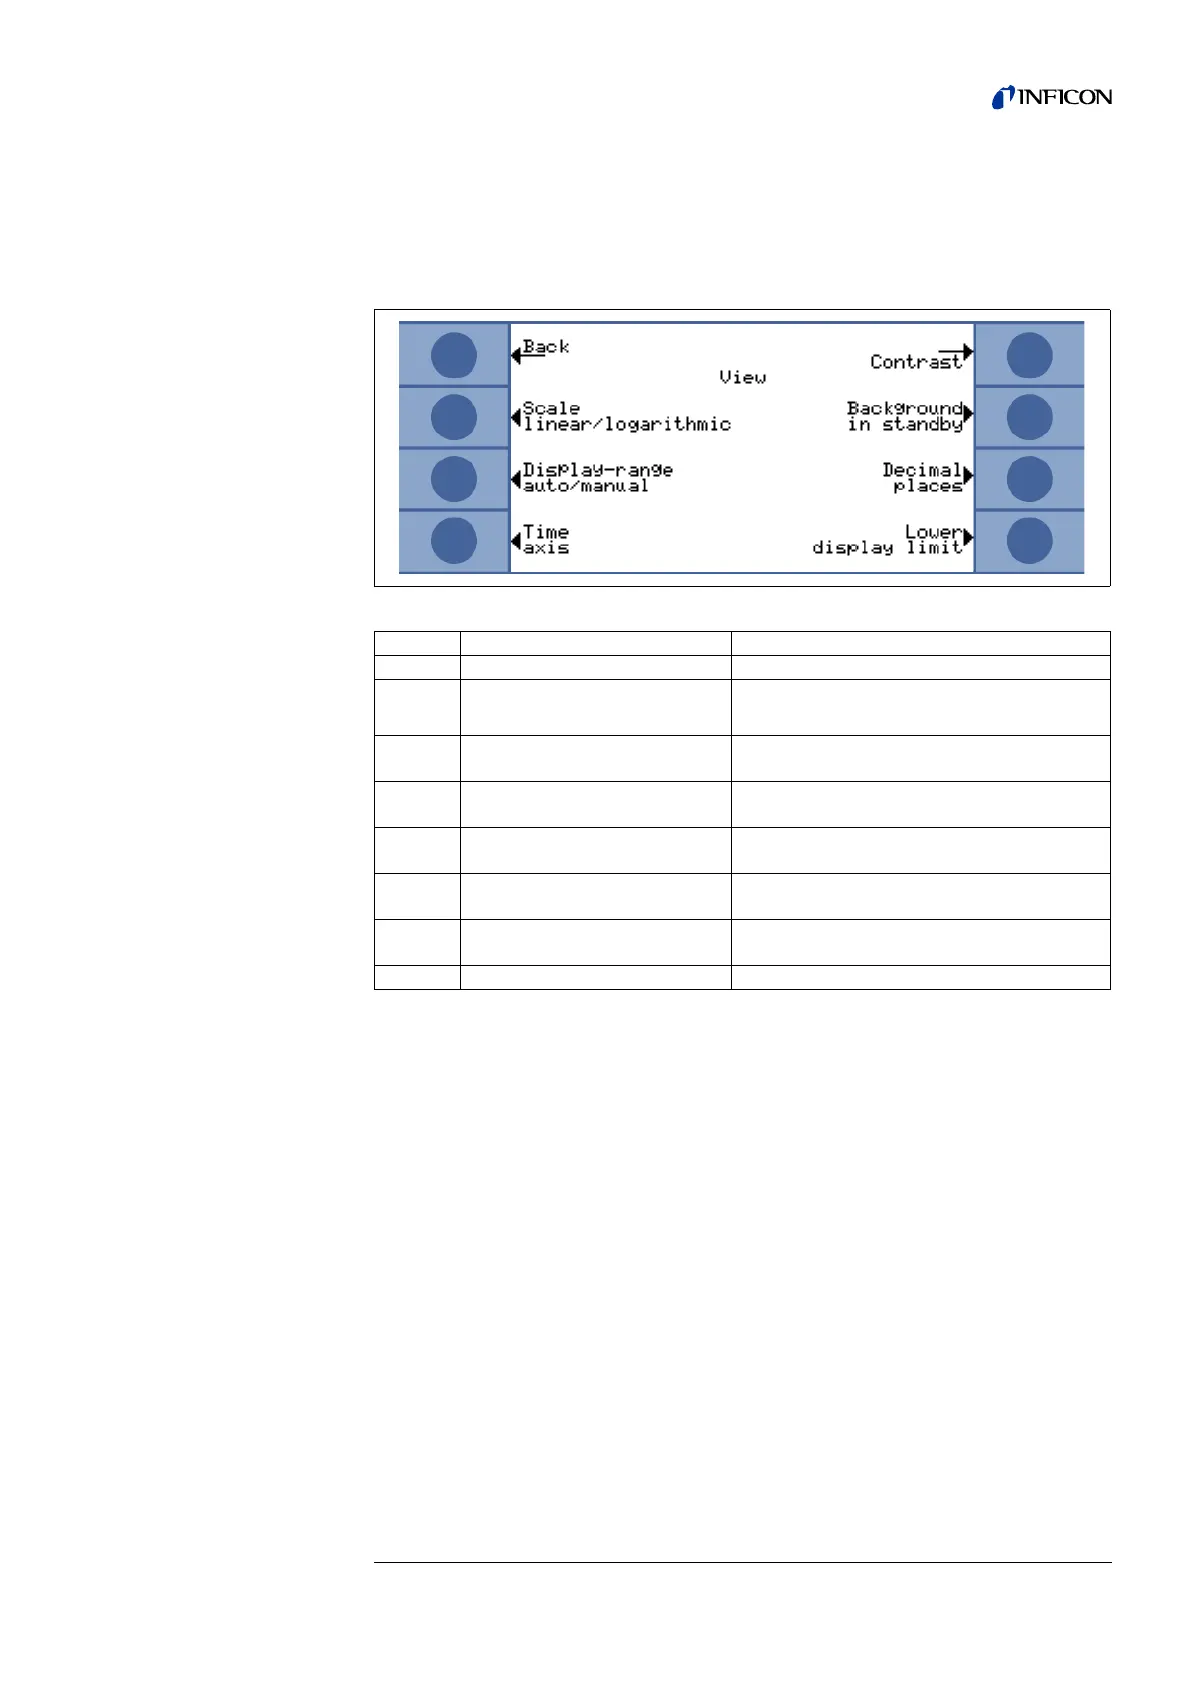
6.2 View
• Main Menu > View
In this menu Fig. 6-3 all features that influence the way data are displayed are put
together.
6.2.1 Scale linear/logarithmic
• Main Menu > View > Scale linear/logarithmic
These settings apply to the bargraph (= bar underneath the digital figures in the
measurement mode) and Y-axis in the trend mode.
The scale of the bargraph can either be linear or logarithmic. With the arrows (up and
down) it can be determined how many decades the bargraph covers.
Usually a logarithmic scale is recommended because leak rates may change easily
over several decades.
Fig. 6-3: The View Menu
Key No. Name Description
1 Back Return to the main menu.
2 Scale linear/logarithmic
Settings for bargraph and trend mode.
Please refer to Chapter 6.2.1.
3 Display-range auto/manual
Manual or automatic scaling. Please refer to
Chapter 6.2.2
4 Time axis
Time axis in trend. Please refer to Chapter
6.2.3
5 Contrast
Display contrast. Please refer to Chapter
6.2.4
6 Background in Stand-by
Background displayed or not. Please refer to
Chapter 6.2.5
7 Decimal places
Number of decimal places. Please refer to
Chapter 6.2.6
8 Lower display limit Please refer to Chapter 6.2.7
Softkey 2: Linear
Pressing this key switches the display to a linear scale, starting at zero.
Softkey 6: Log
The scaling will be displayed logarithmically.