D-0112389-I – 2022/04
Sera™ - Instructions for Use - EN Page 44
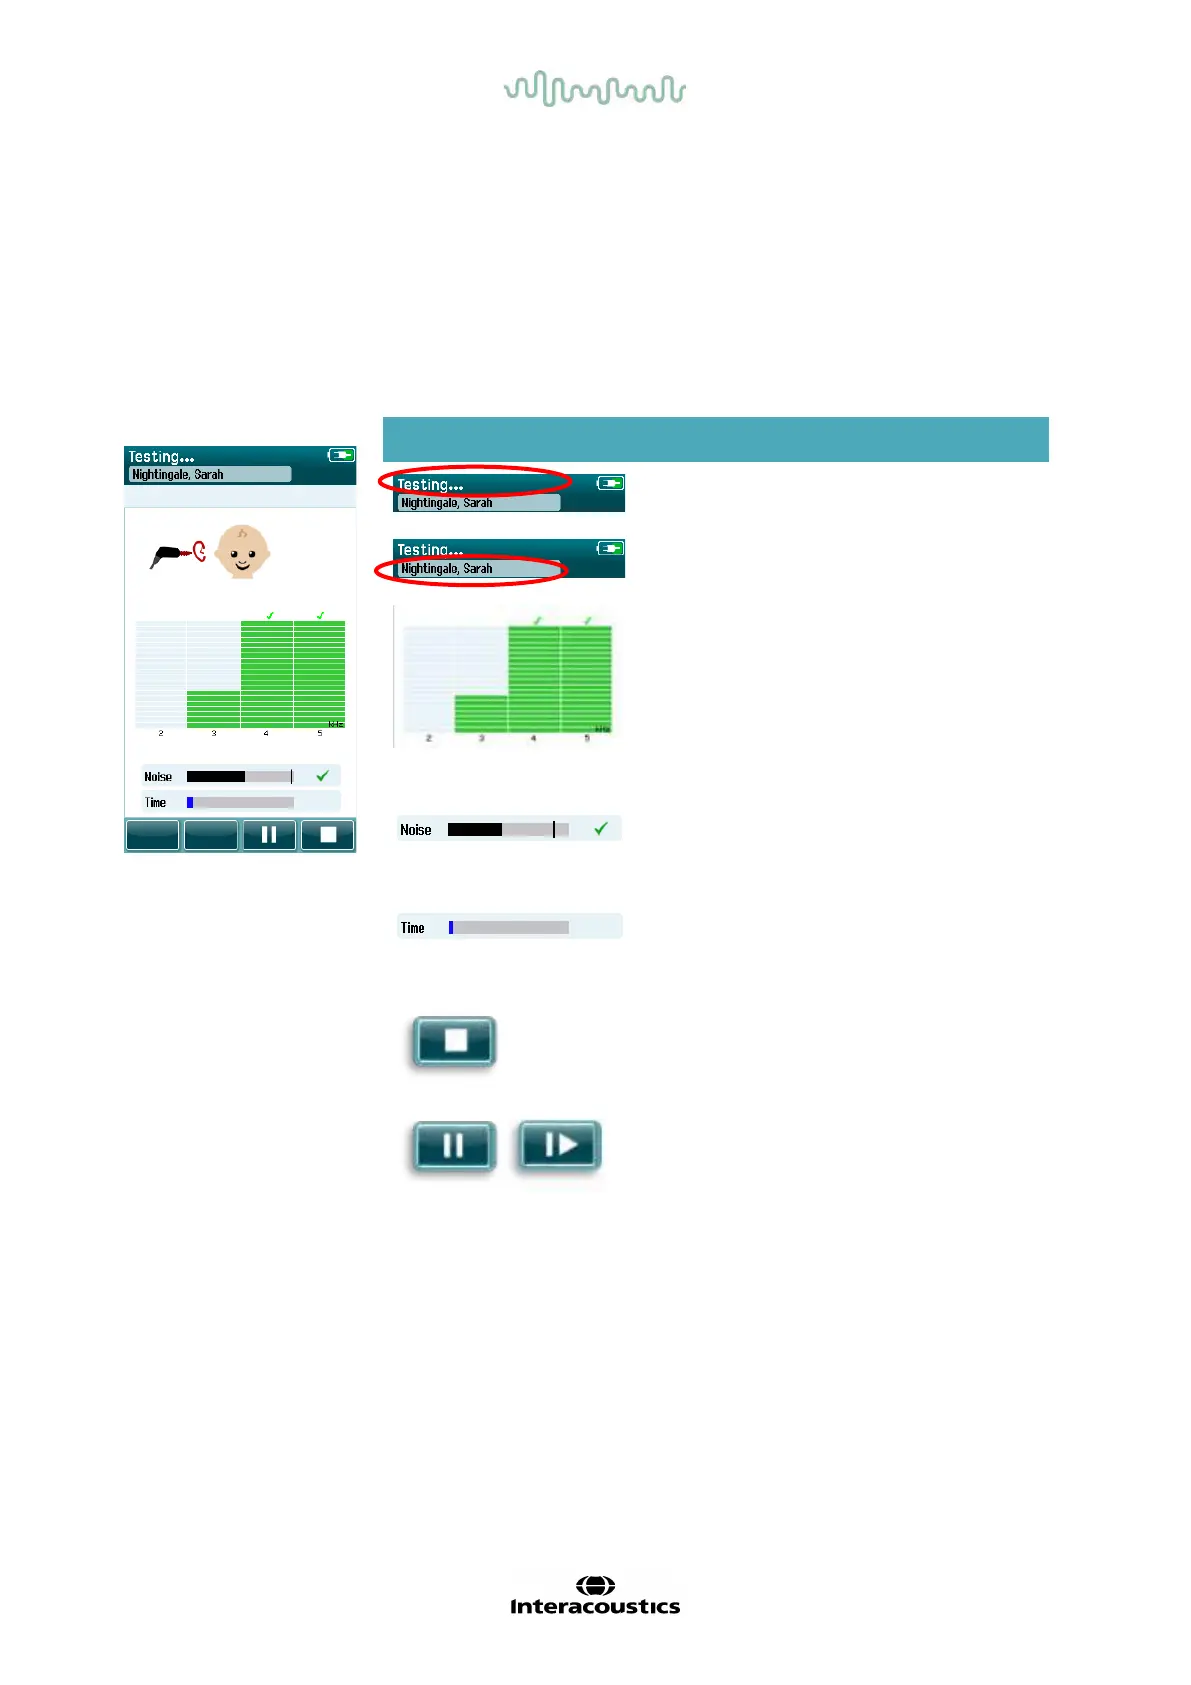
4.8.3 OAE measurement screen
During the OAE measurement, a bar graph f or each of the f requencies in the test protocol reflects the
progress toward a pass (Table 11). The bar will fill up completely in color and a checkmark will appear above
the bar when the criteria for a pass is achieved at the specif ic frequency.
Additionally, horizontal bars for probe stability, noise and test progress appear. When noise and probe
stability are acceptable, a checkmark appears next to the horizontal bar.
Table 11: DPOAE measurement screen.
Screen area/graphic Function name Description
Test status
information.
Indicates device is in
testing mode.
Patient information. Displays the selected
patient name.
Test progress bars.
Provides feedback
about the test progress
for reaching a Pass
result.
Noise bar with
checkmark if noise is
acceptable.
Indicates acceptable
noise rejection level
and status.
Time bar.
Elapsed test time.
Stop button. Stops the test; assigns
an Incomplete result.
Pause/continue
screening button.
Pause/Continue the
measurement.