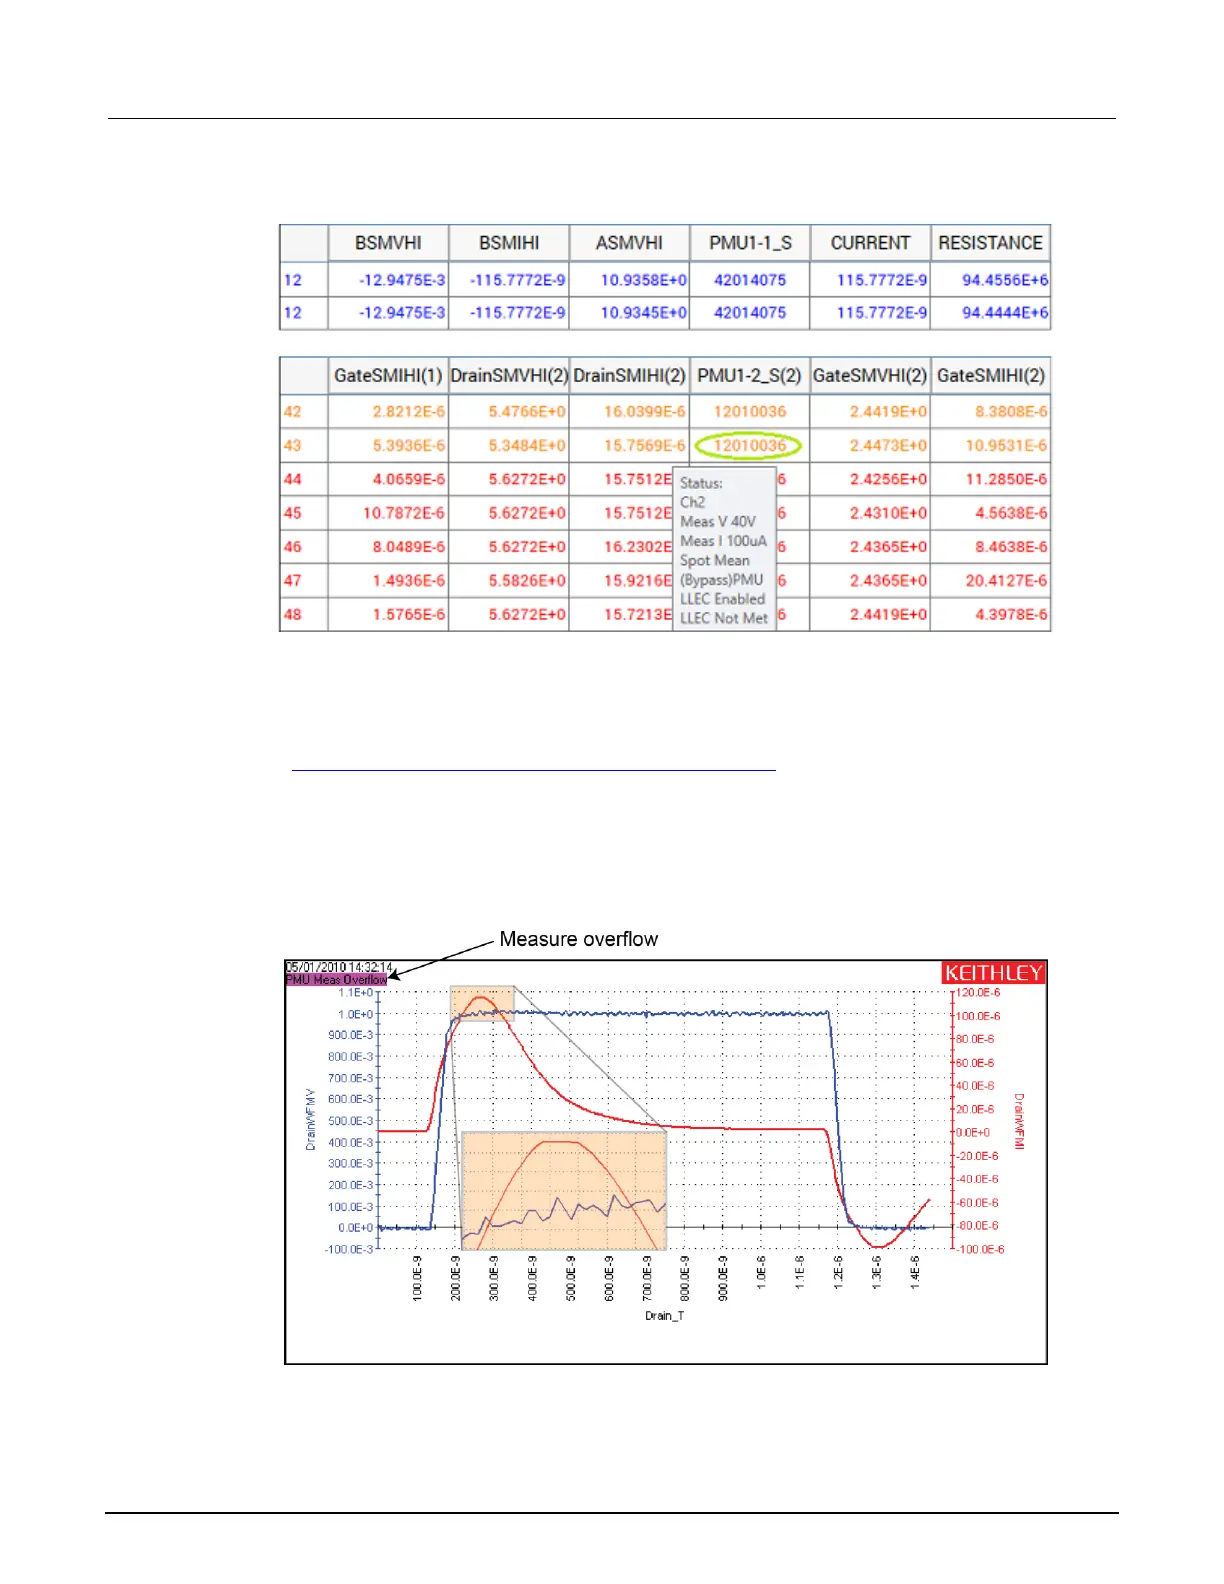
Figure 40: Status tab showing faults
Placing the cursor on a flagged PMU1_1_S cell will open a window that summarizes the fault.
When a measurement fault occurs, a message appears in the upper left corner of the graph. The
figure in PMU and RPM measure ranges are not source ranges (on page 3-38) shows a
measurement overflow on the Graph. The following figure shows a graph with a PMU Measurement
Overflow condition. When troubleshooting a measurement fault (such as the shown measurement
overflow), use the measurement status code to determine the situation and possible fixes.
Figure 41: Sample measurement overflow
 Loading...