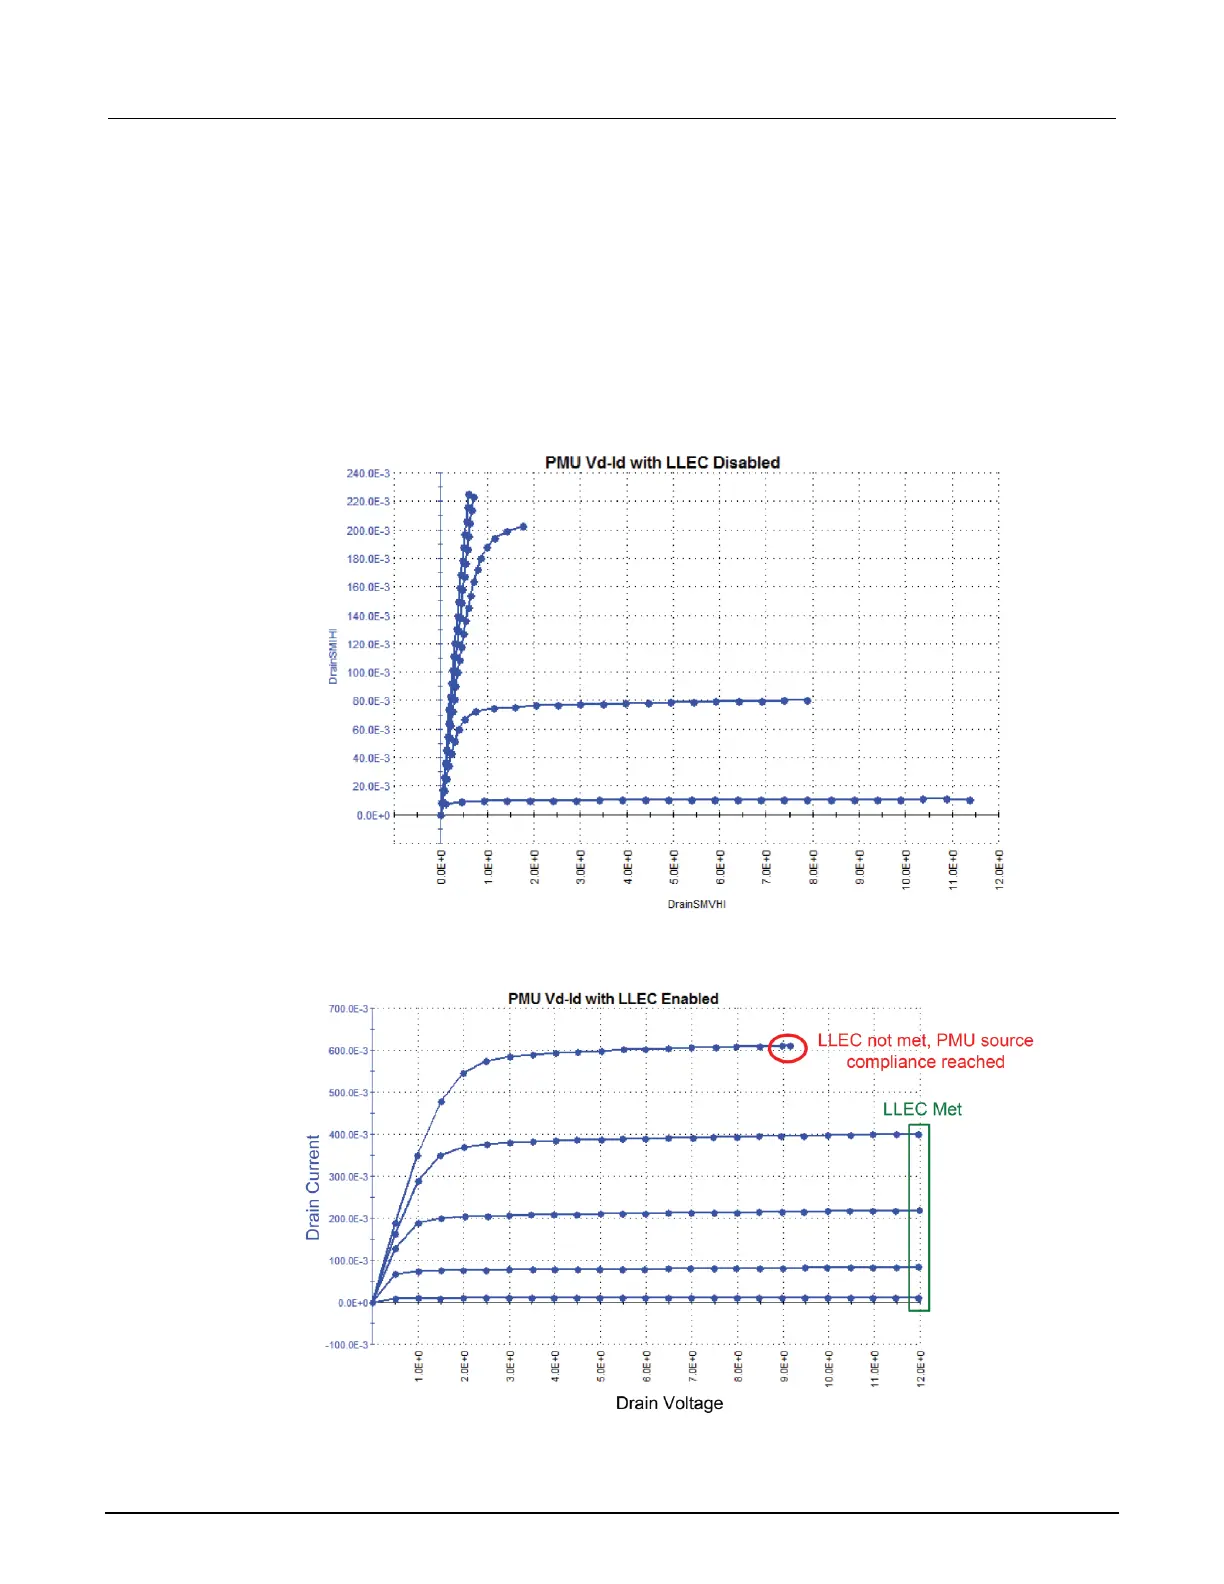
The following figure shows a family of curves from a fairly high-powered device with the load-line
effect. The following figure shows the same device tested with load-line effect compensation enabled.
With LLEC enabled, the curves stop at the programmed V
d
= 12 V. Note that the top curve, in the red
circle, did not reach the 12 V setting. This is because the PMU 40 V source range reached source
compliance. In this case, the PMU is at its limit and cannot source any more voltage or current to this
particular resistance. See the 4200A-SCS Parameter Analyzer Datasheet for more information on the
PMU maximum source power versus device resistance. You can access the datasheet from the
Learning Center.
Figure 74: Vd-Id family of curves, showing load-line effect (LLEC disabled)
Figure 75: Vd-Id family of curves with LLEC enabled (every curve finishes at Vd = 12 V)
 Loading...