53220A/53230A Math, Graphing, and Data Logging 6
Keysight 53220A/53230A User’s Guide 239
Reading decimation
The trend window displays a maximum of 100 readings. When greater than 100
readings are displayed, the readings are decimated - grouped together and
represented by decimation points. The number of readings in a decimation group
is the reading count/100.
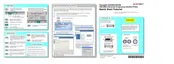
Figure 6-10 is a trend chart of 100,000 readings in which the readings have been
decimated.
Figure 6-10 Trend chart display format (with decimation).
There are 1,000 readings in each decimation group in Figure 6-10
(100,000 readings/100 points displayed). The number of readings in each group
changes if Show All is pressed and readings continue to be taken.
Max: maximum reading values within groups at
decimation points selected by Marker1 (top) and
Marker2 (bottom)
Span: difference in maximum values between marker
locations
Reading: number of first reading in selected
decimation group
Span: number of decimation groups between
marker locations
Min: minimum readings
within groups at selected
decimation points
Limit checking (upper and
lower) enabled through Math
functions (optional)
indicates decimation
and relative max & min
values within the group
position window